> ## Documentation Index
> Fetch the complete documentation index at: https://docs.tai42.ai/llms.txt
> Use this file to discover all available pages before exploring further.
# Admin console & live ops
> Watch a server's health, read its metrics and settings, and drive live operations from the browser.
The Studio is also the live operations console for a server. You confirm it is
healthy, read its metrics and configuration, and drive
[live operations](/concepts/live-operations) — reloading a tool, updating the
manifest, or removing a capability — without a restart and without leaving the
browser.
## Health and metrics
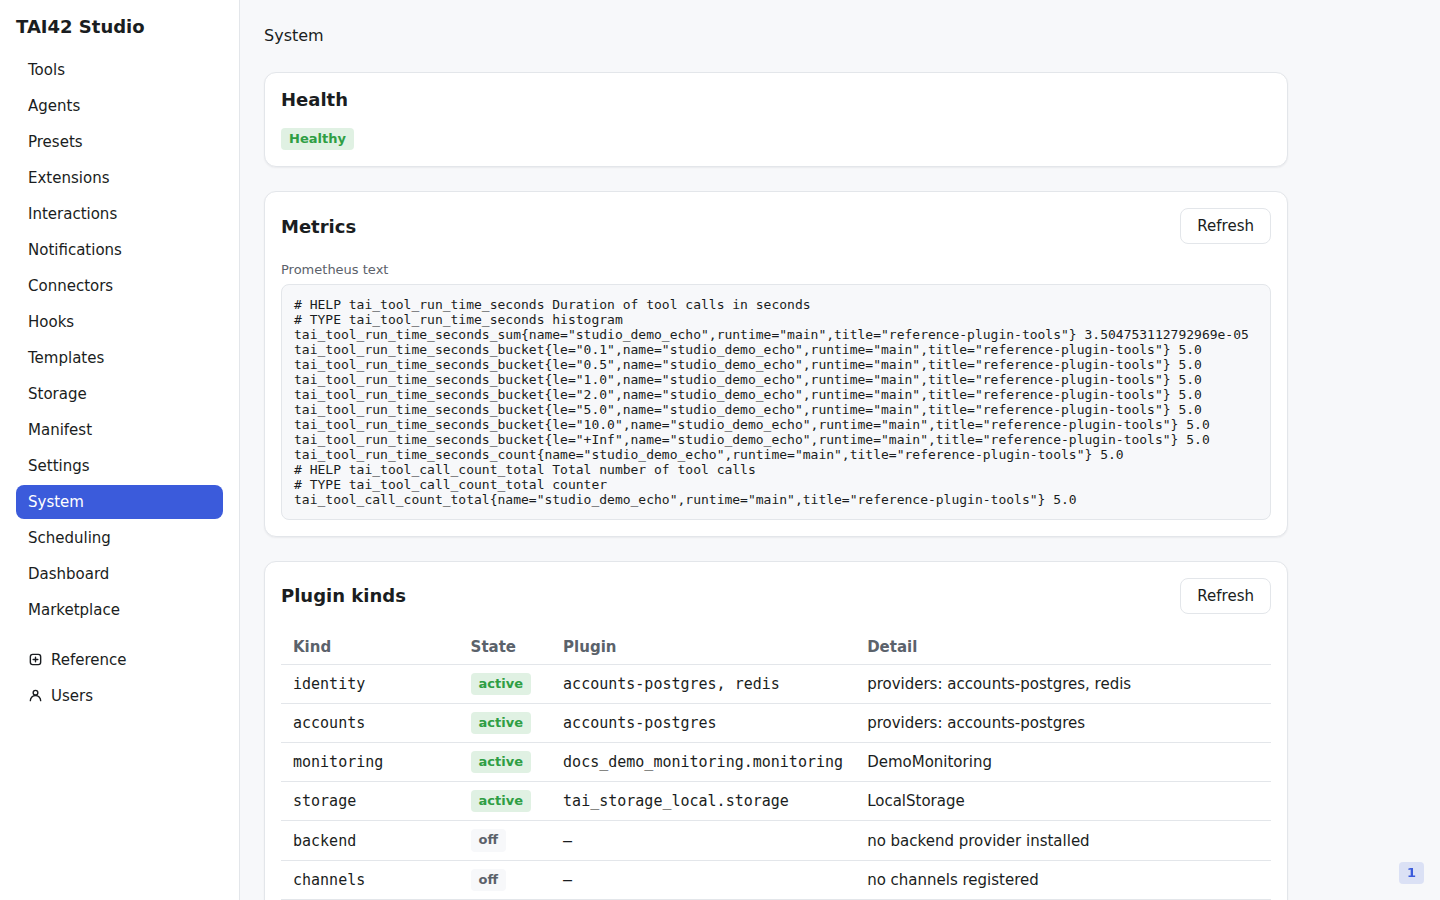
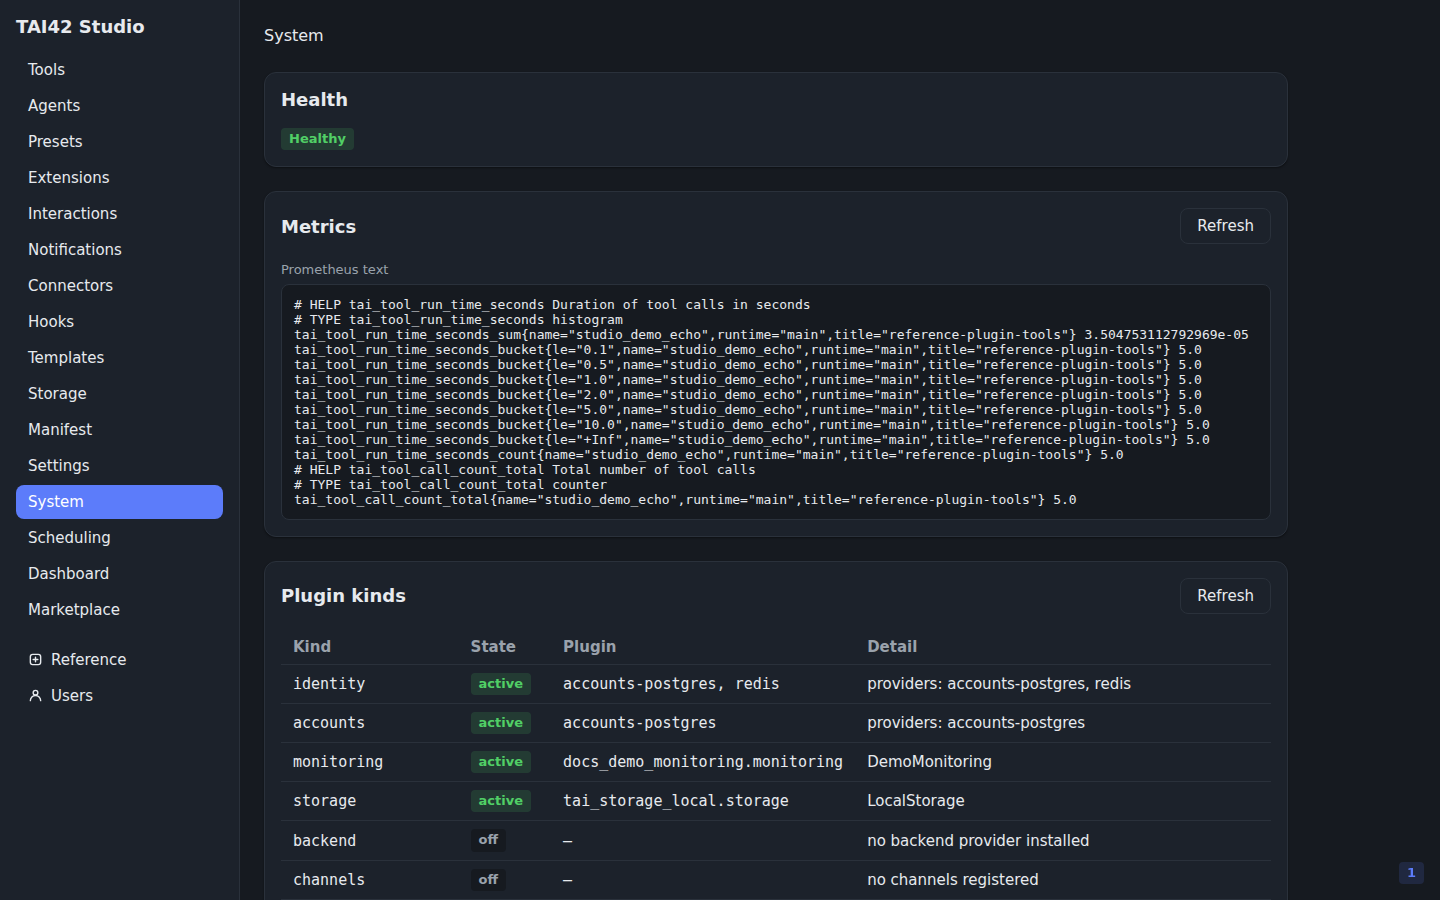
The System screen reads the server's liveness probe and its Prometheus metrics
exposition. A green health badge confirms the server is up and answering; the
Metrics panel renders the same exposition a Prometheus scraper reads. The demo
instance below shows both — a populated `Healthy` badge and the Metrics panel
rendering live counters. On a server that has not emitted any metrics yet, the
panel shows a "No metrics reported" empty state instead.
 ## The kinds table
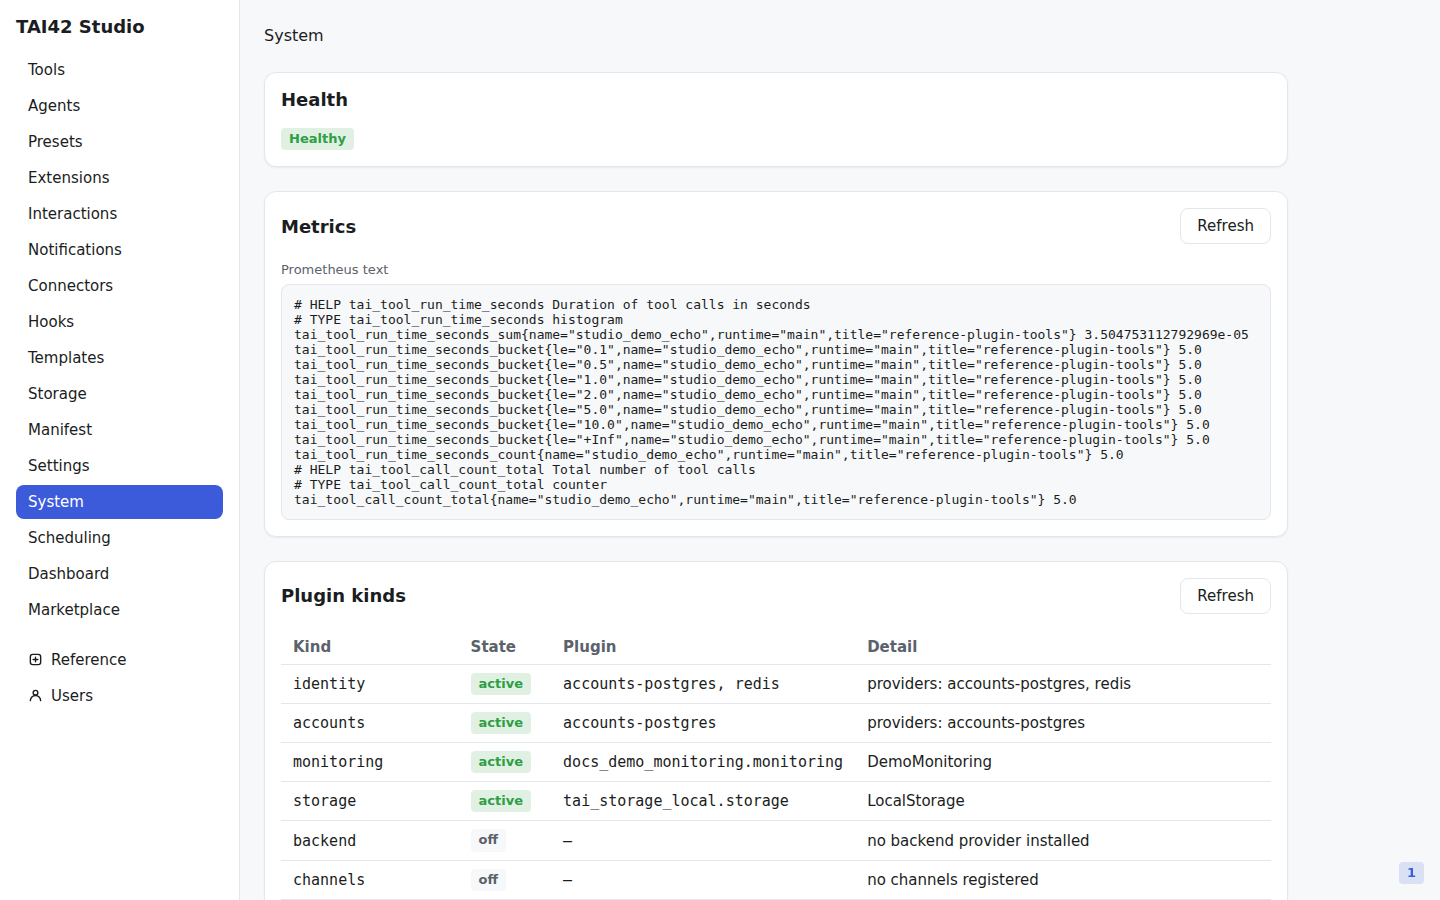
The System screen also reads the server's **kinds** summary — the plugin kinds
the server knows about and, for each, whether it is **active** (a provider is
configured and running), running on a **default** (the built-in fallback is in
use), or **off** (the kind is not configured). It is the fastest way to confirm
which providers a running server actually resolved — for example, which
[identity and accounts](/concepts/accounts) providers the configured
[auth-provider](/concepts/access-control) chain brought up. The same summary is
served at `GET /api/system/kinds` and printed in the server's startup log — see
[live operations](/concepts/live-operations#the-kinds-summary).
## The kinds table
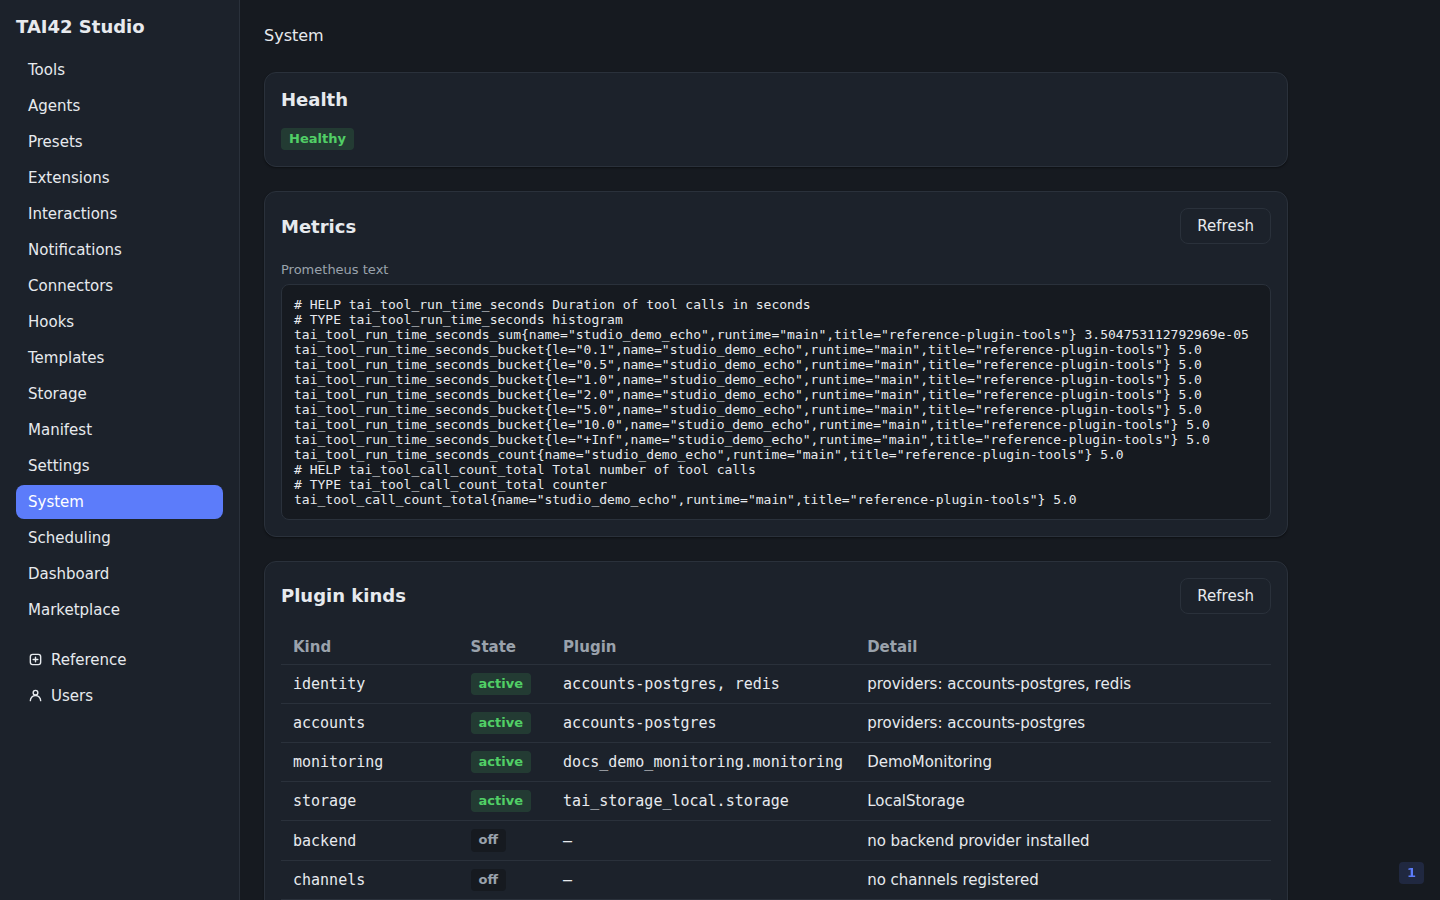
The System screen also reads the server's **kinds** summary — the plugin kinds
the server knows about and, for each, whether it is **active** (a provider is
configured and running), running on a **default** (the built-in fallback is in
use), or **off** (the kind is not configured). It is the fastest way to confirm
which providers a running server actually resolved — for example, which
[identity and accounts](/concepts/accounts) providers the configured
[auth-provider](/concepts/access-control) chain brought up. The same summary is
served at `GET /api/system/kinds` and printed in the server's startup log — see
[live operations](/concepts/live-operations#the-kinds-summary).
 ## User administration
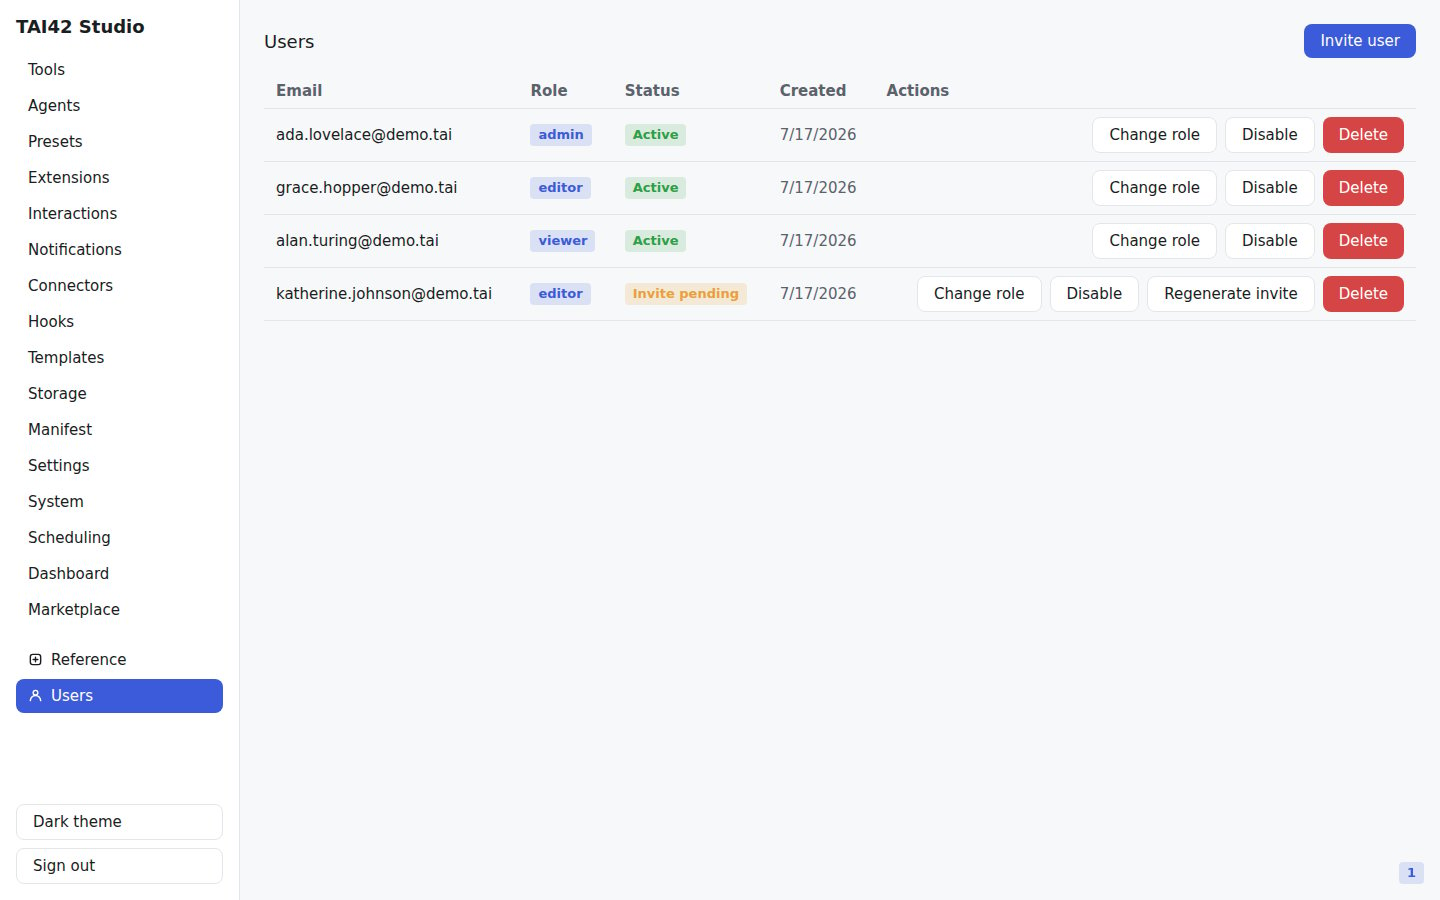
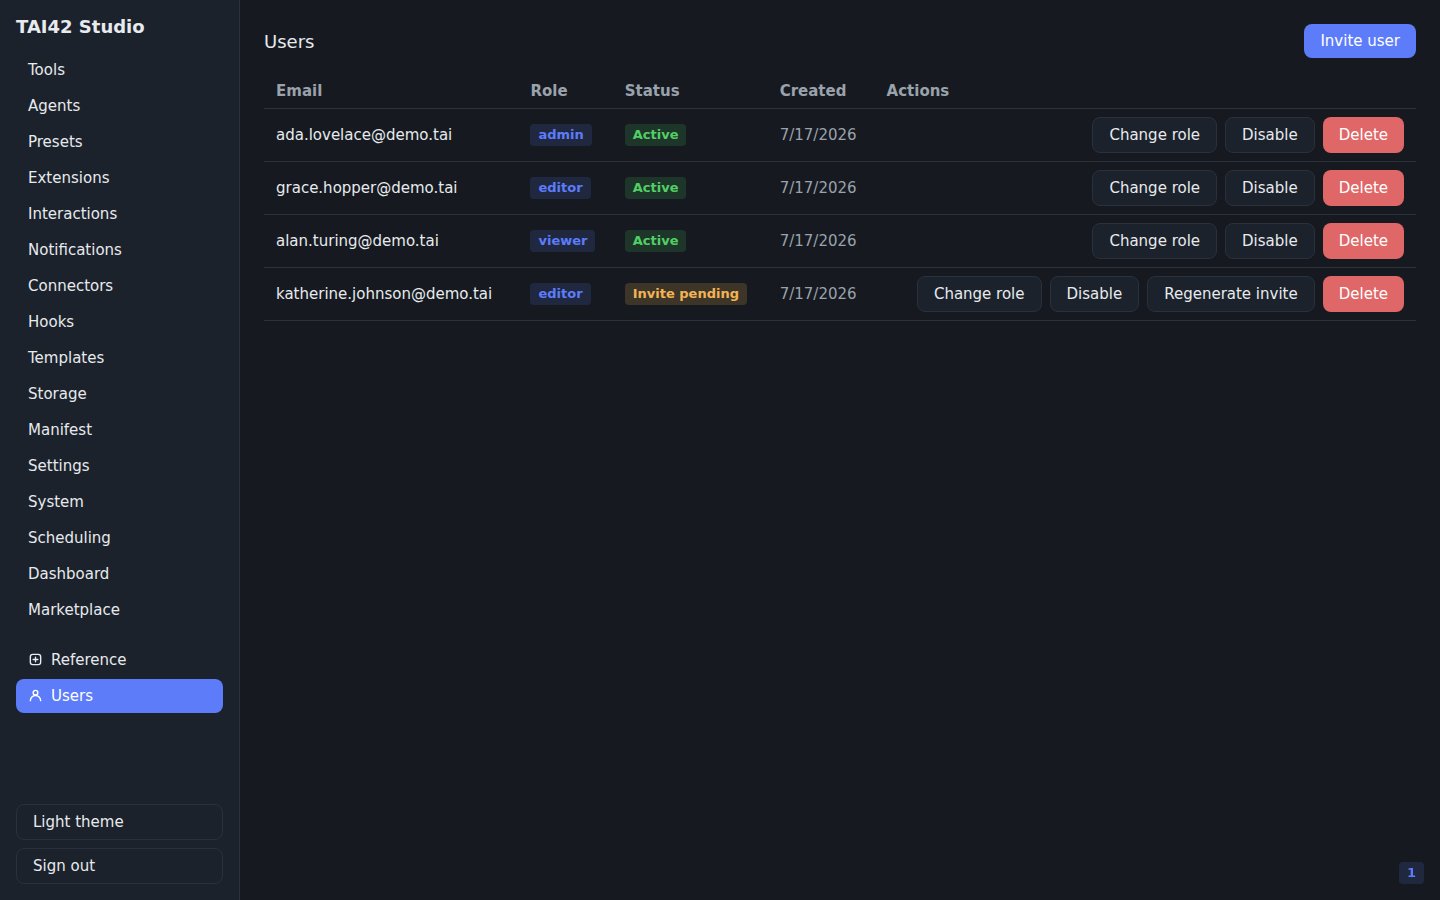
When a server runs an [accounts](/concepts/accounts) provider that ships a Studio
page, that page mounts into the shell as its own **users-admin** surface — an
example of the [studio plugin](/studio/plugins) model, where a plugin contributes
UI, not just API routes. From it an admin manages **human accounts**: create a
user, issue an [invite](/studio/login#invites), apply a [role](/concepts/accounts#roles-are-policy-templates),
and disable an account.
The page governs only the `usr-*` human principals. Machine keys are managed on
the [API keys](/studio/api-keys) surface, and non-human sign-in subjects
(`oidc:*`, `idp:*`) through the raw [access-control](/concepts/access-control)
policy routes — see the [principal-type split](/concepts/accounts#what-the-users-admin-page-governs).
## User administration
When a server runs an [accounts](/concepts/accounts) provider that ships a Studio
page, that page mounts into the shell as its own **users-admin** surface — an
example of the [studio plugin](/studio/plugins) model, where a plugin contributes
UI, not just API routes. From it an admin manages **human accounts**: create a
user, issue an [invite](/studio/login#invites), apply a [role](/concepts/accounts#roles-are-policy-templates),
and disable an account.
The page governs only the `usr-*` human principals. Machine keys are managed on
the [API keys](/studio/api-keys) surface, and non-human sign-in subjects
(`oidc:*`, `idp:*`) through the raw [access-control](/concepts/access-control)
policy routes — see the [principal-type split](/concepts/accounts#what-the-users-admin-page-governs).
 The users-admin page is contributed by an accounts provider plugin. Its exact
fields and controls come from that plugin; the concrete provider setup lives in
the plugin's own repository README, not on this site.
## The operations dashboard
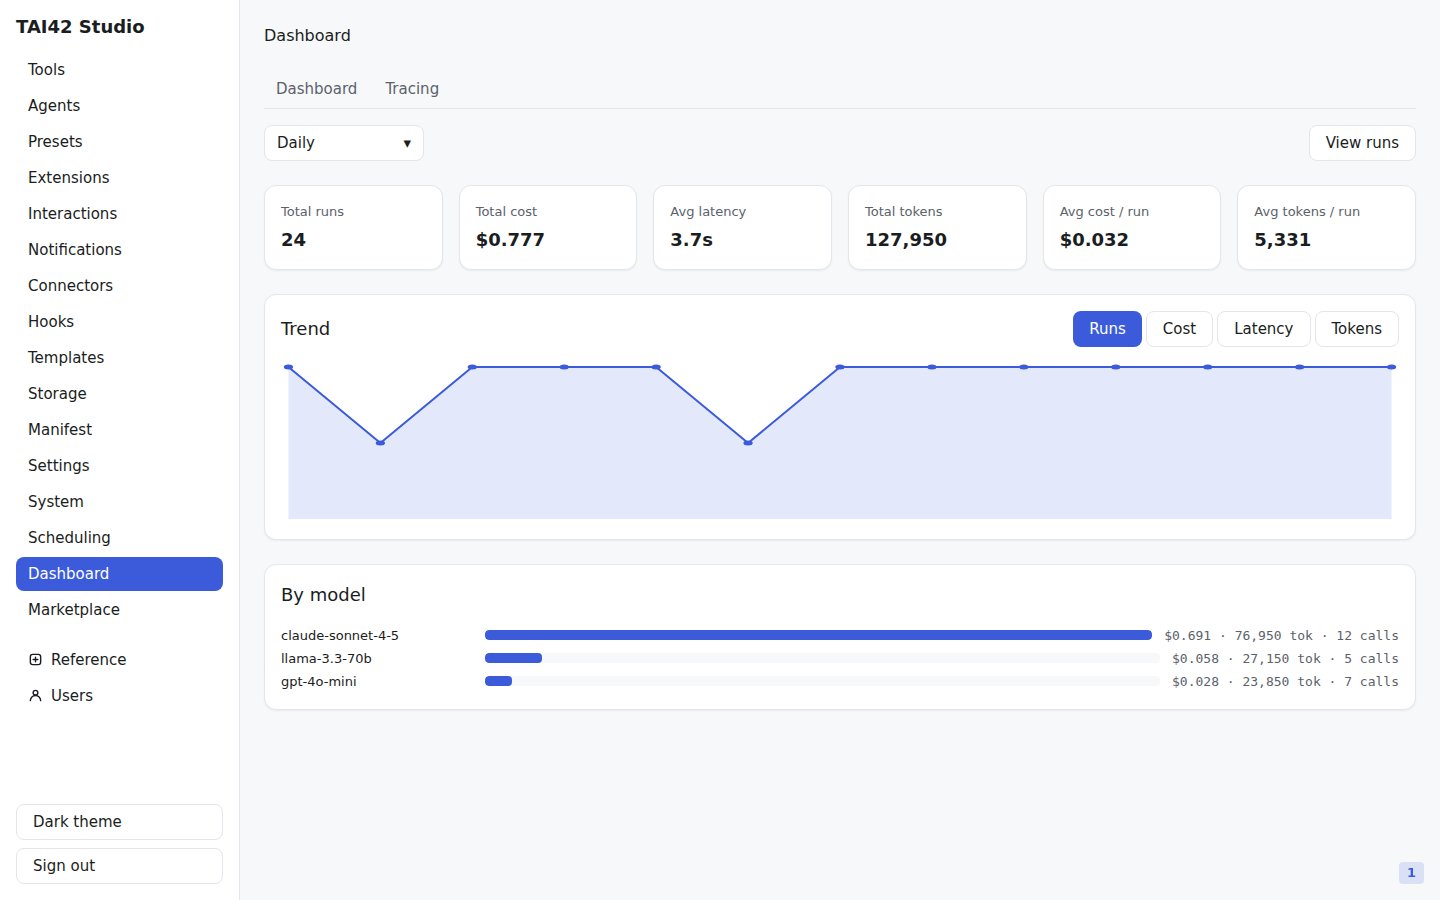
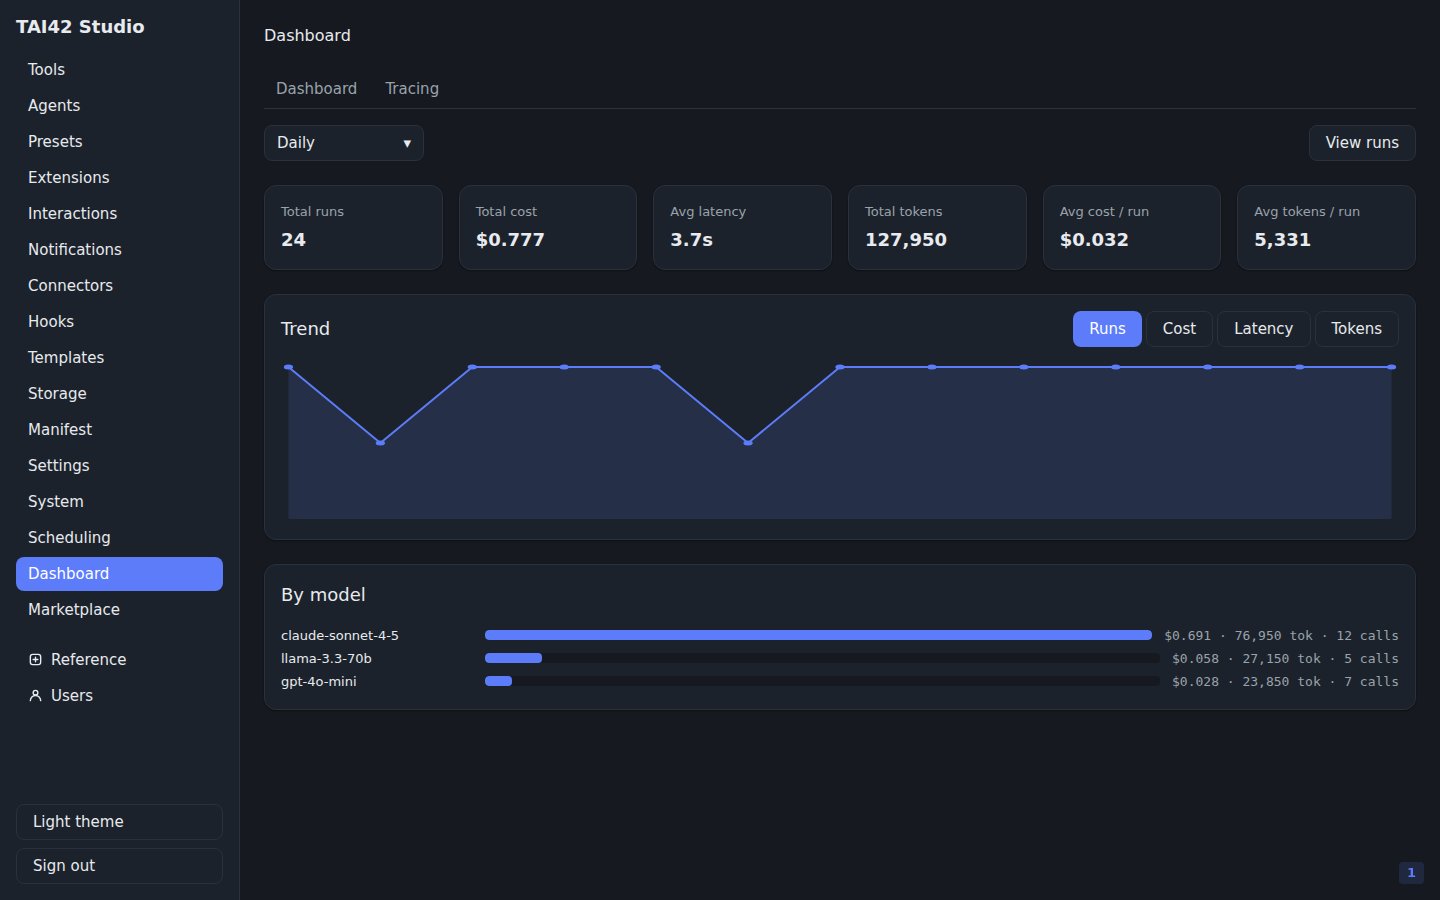
The Dashboard summarises the server's [monitoring](/concepts/live-operations)
backend — total runs, cost, latency, and token counts over a time range, with a
per-model breakdown and a trend chart. It answers "what has this server been
doing" at a glance. The demo instance below is populated from a monitoring
backend seeded with example runs, so the summary tiles, trend chart, and
per-model breakdown show representative data. With no monitoring backend
registered, the Dashboard renders a clean empty state instead.
The users-admin page is contributed by an accounts provider plugin. Its exact
fields and controls come from that plugin; the concrete provider setup lives in
the plugin's own repository README, not on this site.
## The operations dashboard
The Dashboard summarises the server's [monitoring](/concepts/live-operations)
backend — total runs, cost, latency, and token counts over a time range, with a
per-model breakdown and a trend chart. It answers "what has this server been
doing" at a glance. The demo instance below is populated from a monitoring
backend seeded with example runs, so the summary tiles, trend chart, and
per-model breakdown show representative data. With no monitoring backend
registered, the Dashboard renders a clean empty state instead.
 ## Settings
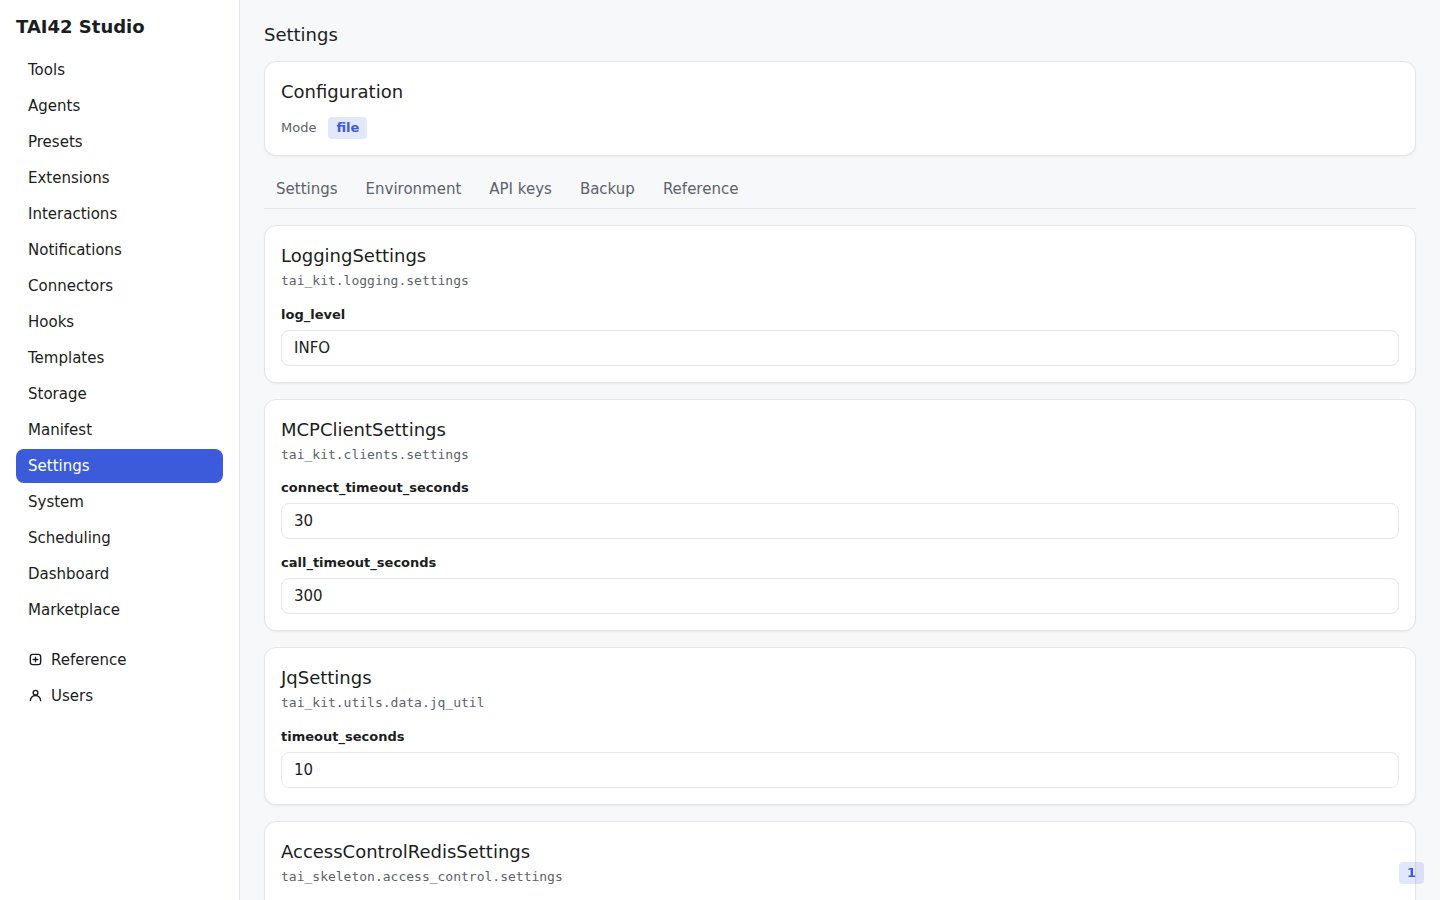
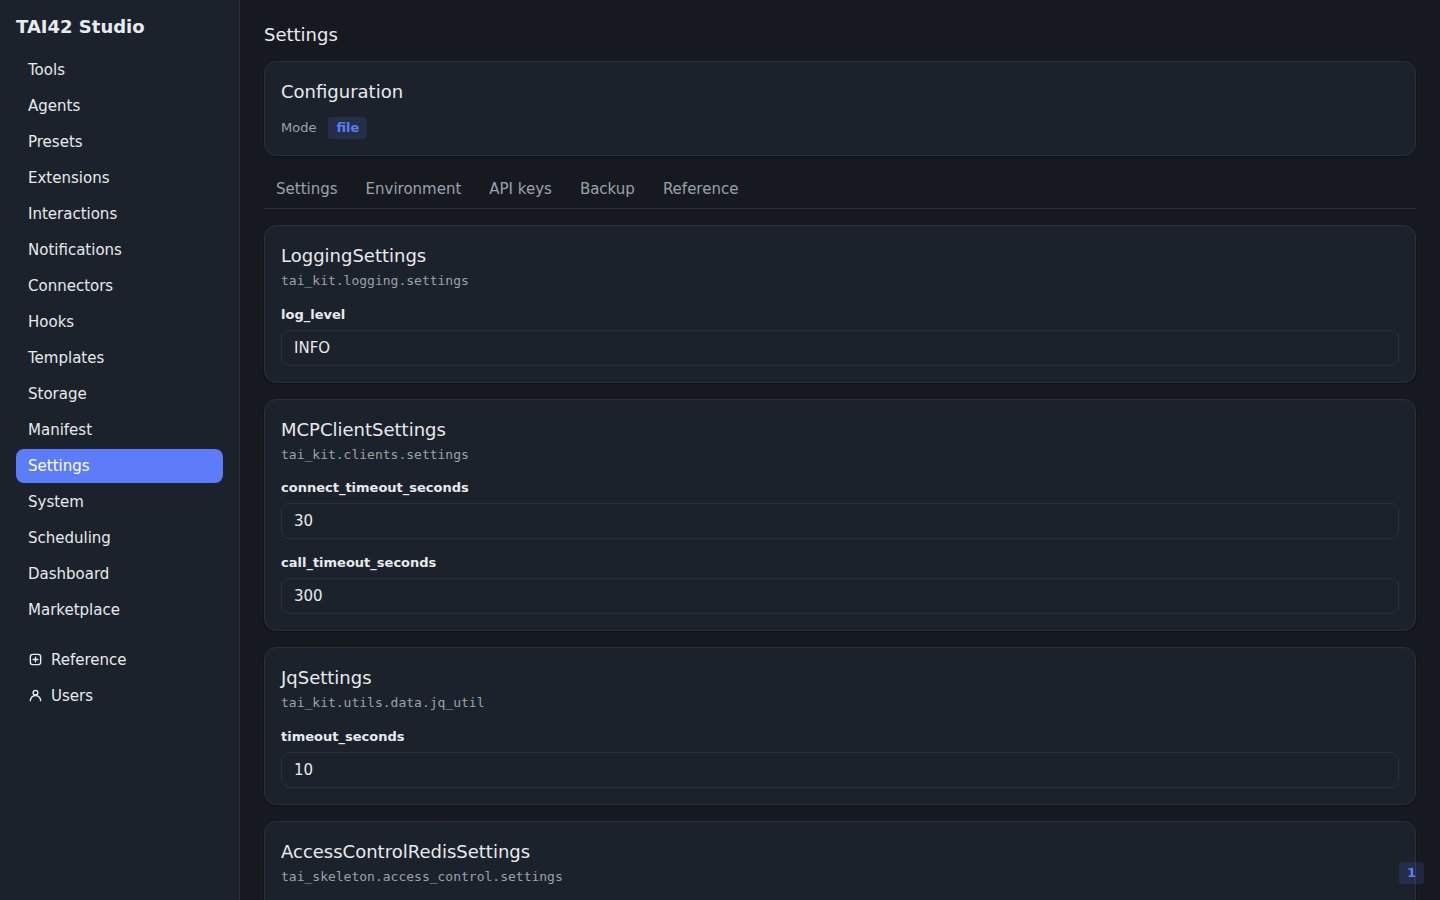
The Settings screen reads the server's configuration mode and its settings
schema, exposes the environment values, and hosts the API-keys tab. It surfaces
each subsystem's settings — connector crypto, engine config, store connections —
as an editable form.
## Settings
The Settings screen reads the server's configuration mode and its settings
schema, exposes the environment values, and hosts the API-keys tab. It surfaces
each subsystem's settings — connector crypto, engine config, store connections —
as an editable form.
 ## Live operations
Because the Studio drives the same `/api/*` surface as the
[`tai` CLI](/reference/cli/index), the management
[operations](/concepts/live-operations) are one run away. From the Tools screen
you invoke `reload_tool`, `remove_tool`, or `reload_config` — the
[live operations](/concepts/live-operations) — to reload a tool, drop one from
the live registry, or soft-restart the server in place. While a reload is in
flight, the API answers dispatch routes with a retriable `503` rather than
serving against a half-swapped registry.
Anything the console does maps to an HTTP route and a CLI command. Reach for
`tai mcp status` or `tai tools run` from a terminal when you want the same
operation scripted.
See [live operations](/concepts/live-operations) for the management operations, and
the [CLI reference](/reference/cli/index) and
[HTTP API reference](/reference/api/index) for the routes behind each screen.
## Live operations
Because the Studio drives the same `/api/*` surface as the
[`tai` CLI](/reference/cli/index), the management
[operations](/concepts/live-operations) are one run away. From the Tools screen
you invoke `reload_tool`, `remove_tool`, or `reload_config` — the
[live operations](/concepts/live-operations) — to reload a tool, drop one from
the live registry, or soft-restart the server in place. While a reload is in
flight, the API answers dispatch routes with a retriable `503` rather than
serving against a half-swapped registry.
Anything the console does maps to an HTTP route and a CLI command. Reach for
`tai mcp status` or `tai tools run` from a terminal when you want the same
operation scripted.
See [live operations](/concepts/live-operations) for the management operations, and
the [CLI reference](/reference/cli/index) and
[HTTP API reference](/reference/api/index) for the routes behind each screen.