

Health
The System screen reads the server’s liveness probe. A greenHealthy badge
confirms the server is up and answering. The demo instance below shows a
populated Healthy badge.
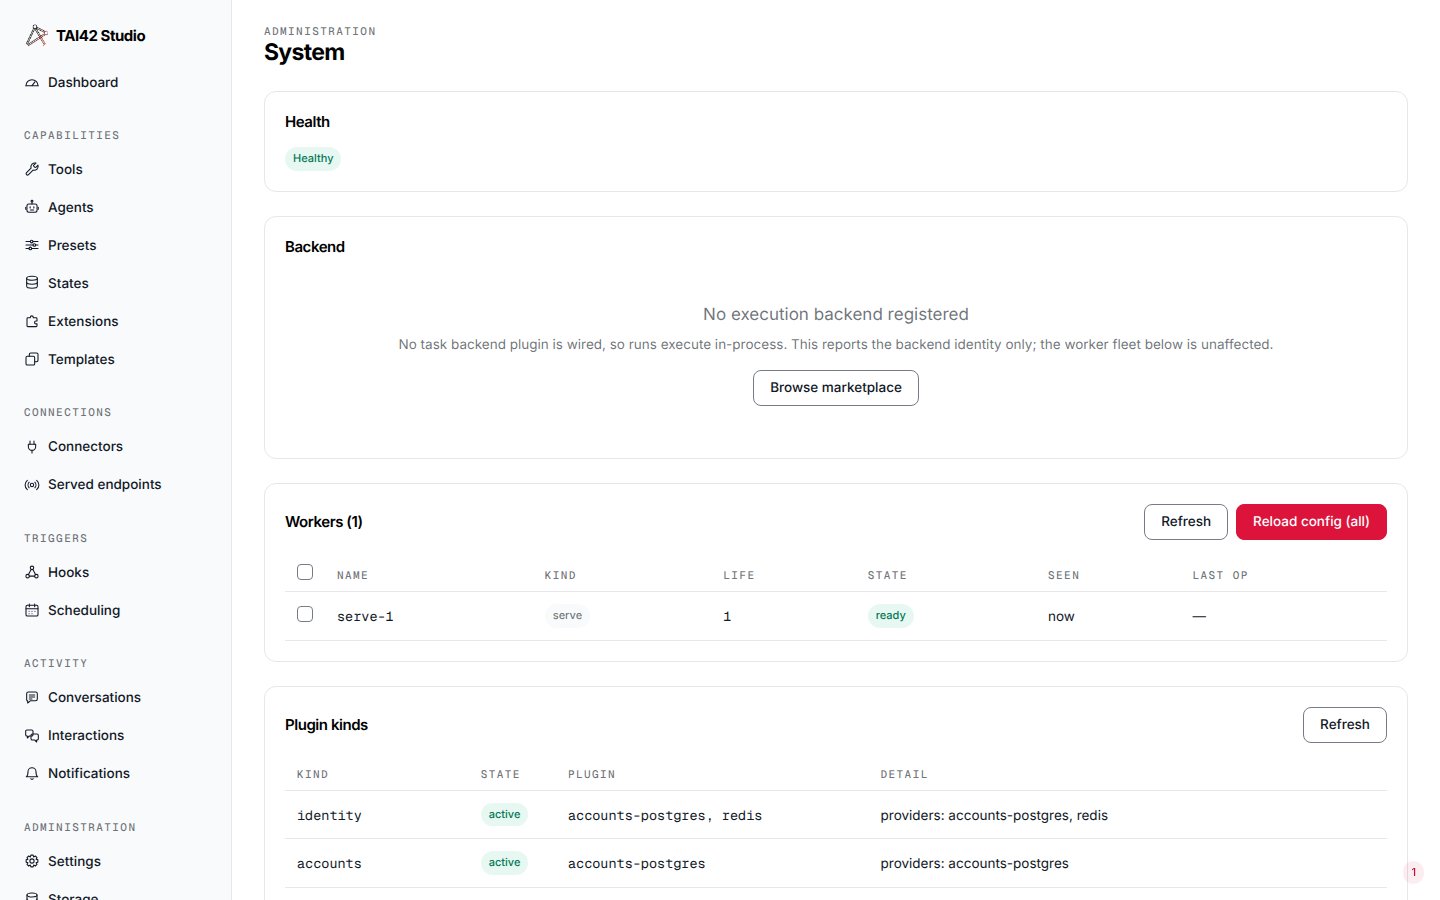
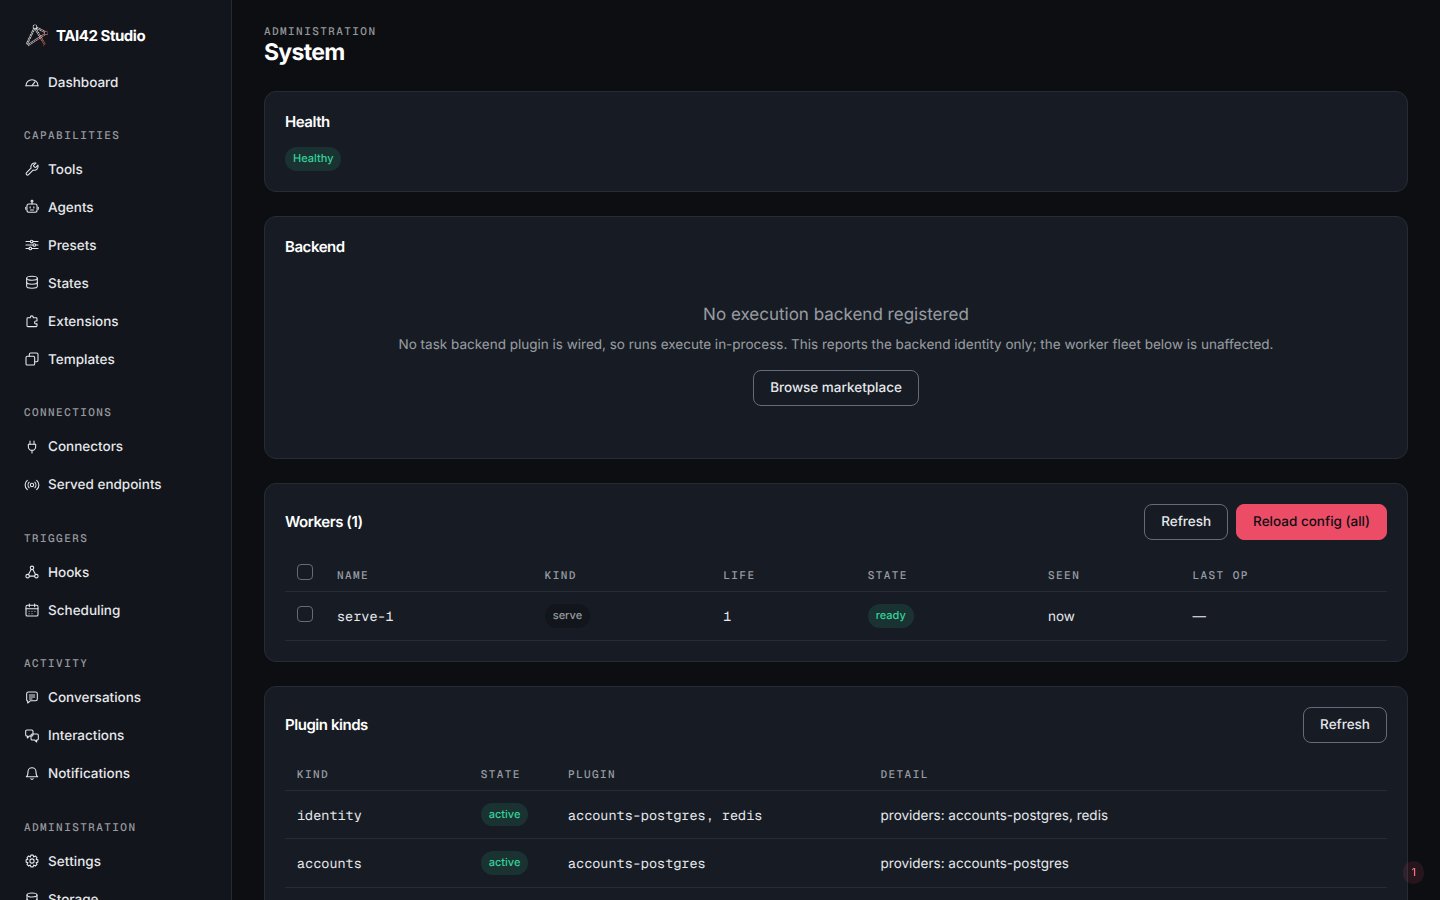
The System screen: a populated 'Healthy' badge from the server's liveness probe.
The kinds table
The System screen also reads the server’s kinds summary — the plugin kinds the server knows about and, for each, whether it is active (a provider is configured and running), running on a default (the built-in fallback is in use), or off (the kind is not configured). It is the fastest way to confirm which providers a running server actually resolved — for example, which identity and accounts providers the configured auth-provider chain brought up. The same summary is served atGET /api/system/kinds and printed in the server’s startup log — see
live operations.
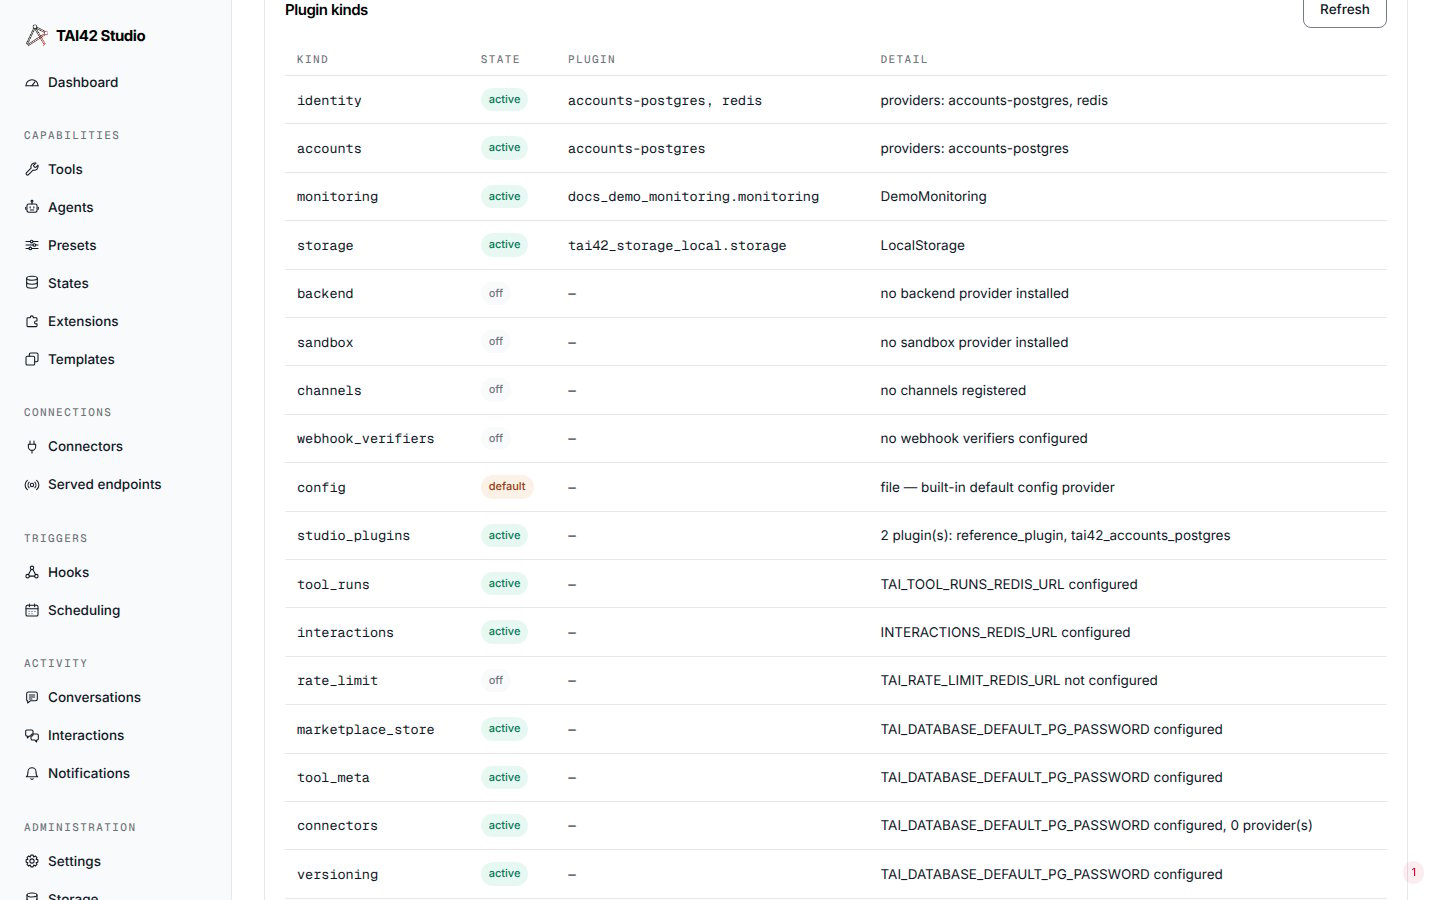
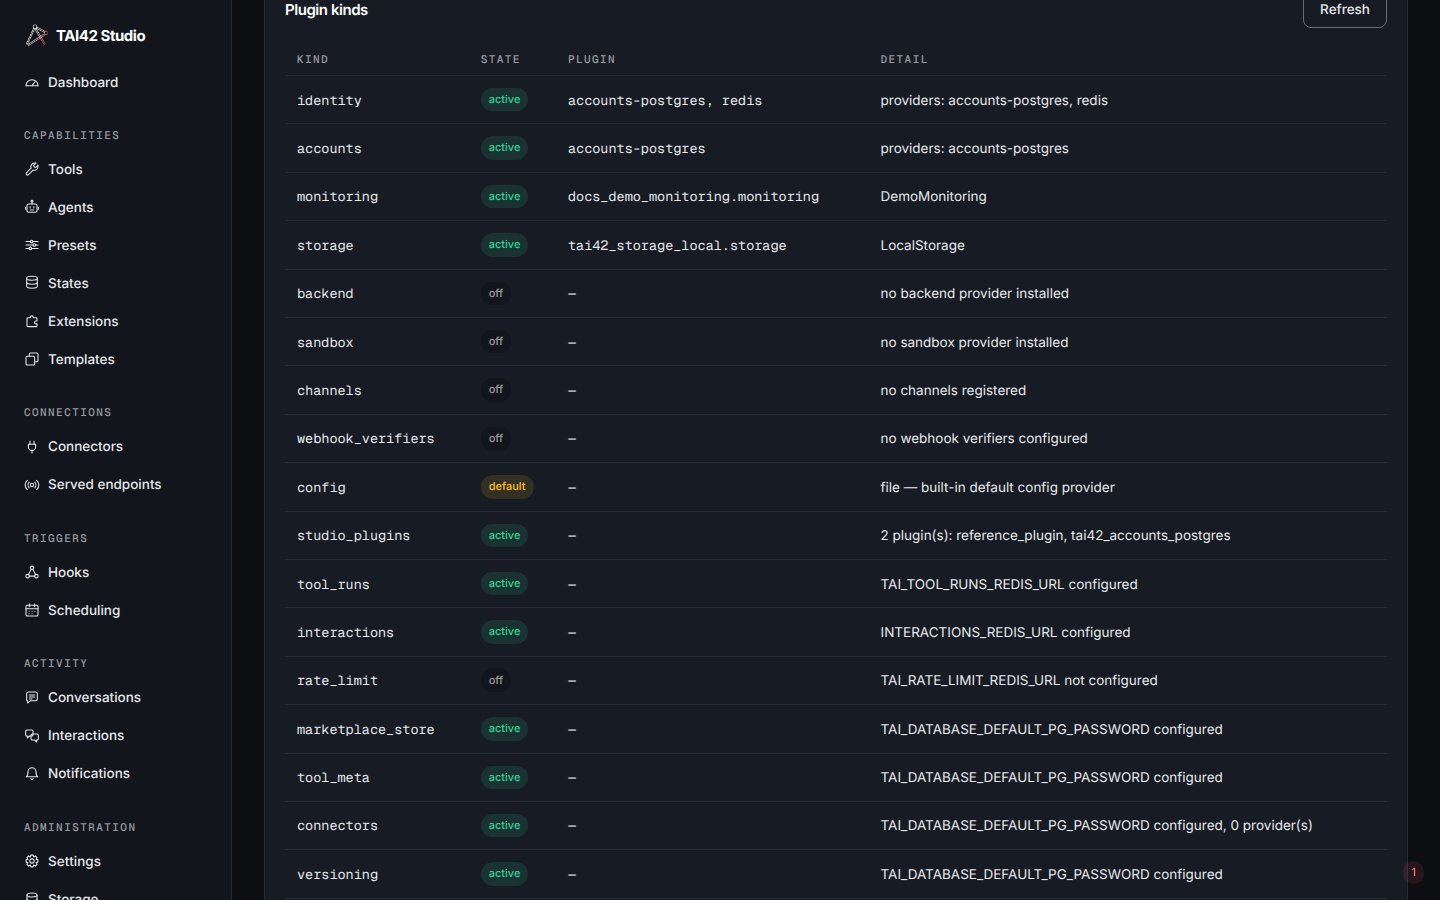
The System screen's kinds table: each known plugin kind with its active, default, or off status.
User administration
When a server runs an accounts provider that ships a Studio page, that page mounts into the shell as its own users-admin surface — an example of the studio plugin model, where a plugin contributes UI, not just API routes. From it an admin manages human accounts: create a user, issue an invite, apply a role, and disable an account. The role picker reflects the current editable role set (the seeded admin/editor/viewer plus any role an admin has created withtai roles).
The page governs only the usr-* human principals. Machine keys are managed on
the API keys surface, and non-human sign-in subjects
(oidc:*, idp:*) through the raw access-control
policy routes — see the principal-type split.
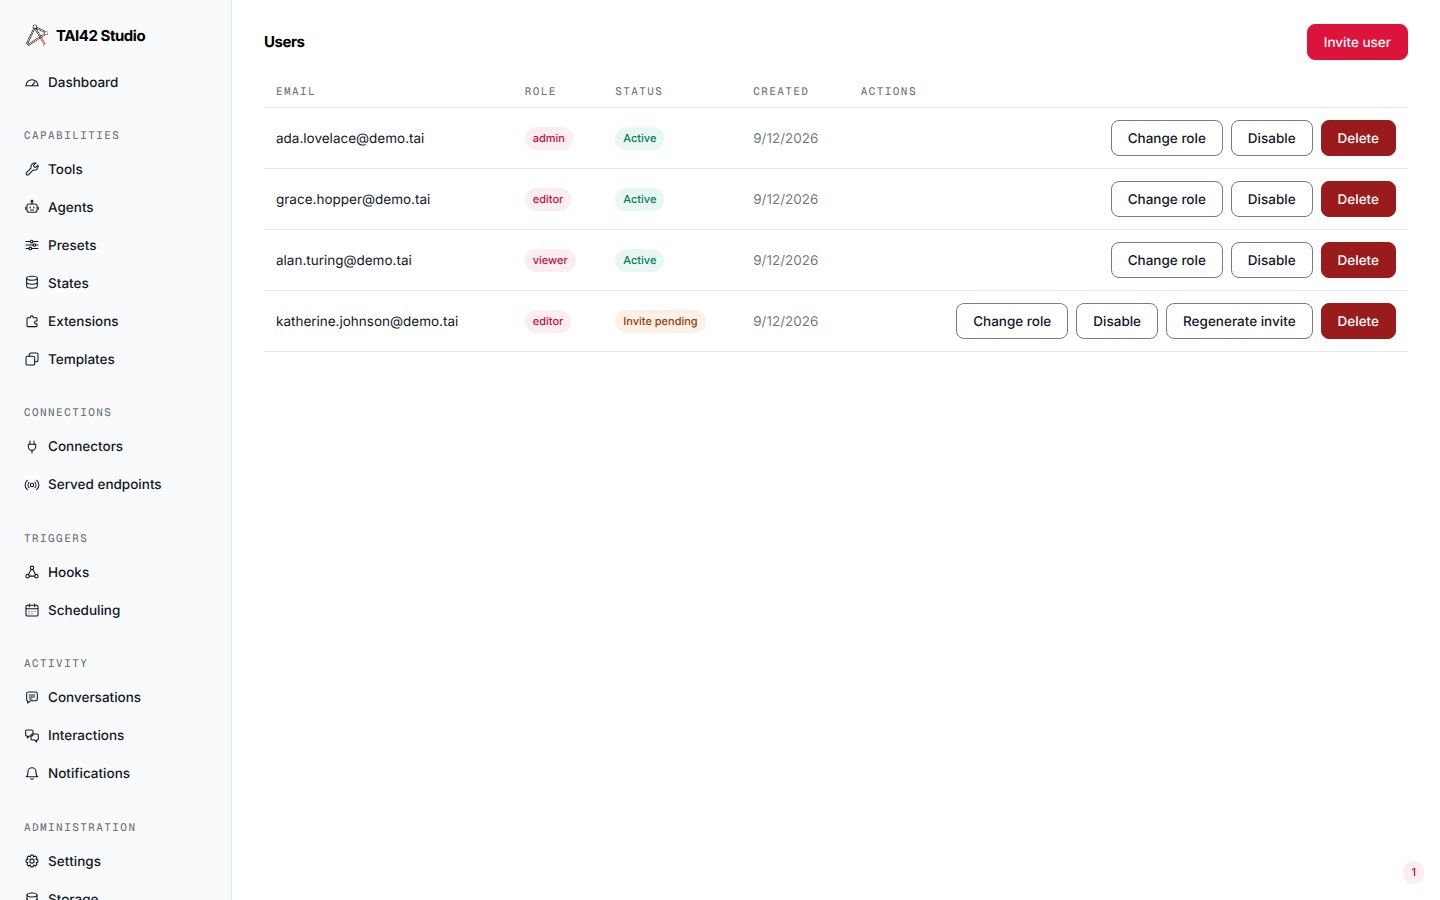
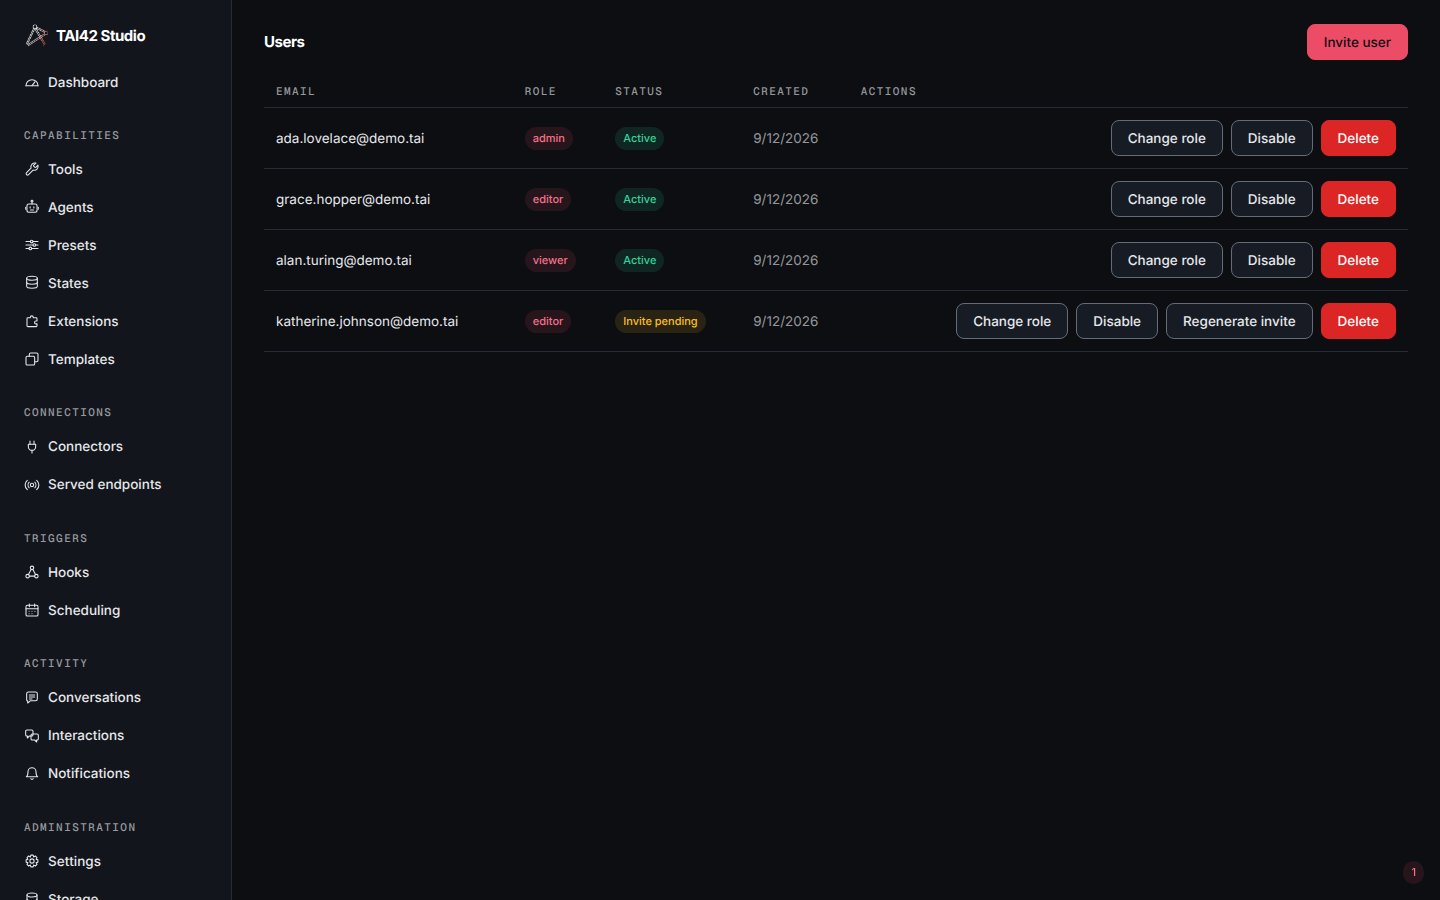
The plugin-contributed users-admin page: the human accounts on a server, with invite and role controls.
The users-admin page is contributed by an accounts provider plugin. Its exact
fields and controls come from that plugin; the concrete provider setup lives in
the plugin’s own repository README, not on this site.
The operations dashboard
The Dashboard summarises the server’s monitoring backend — total runs, cost, latency, and token counts over a time range, with a per-model breakdown and a trend chart. It answers “what has this server been doing” at a glance. The demo instance below is populated from a monitoring backend seeded with example runs, so the summary tiles, trend chart, and per-model breakdown show representative data. With no monitoring backend registered, the Dashboard renders a clean empty state instead.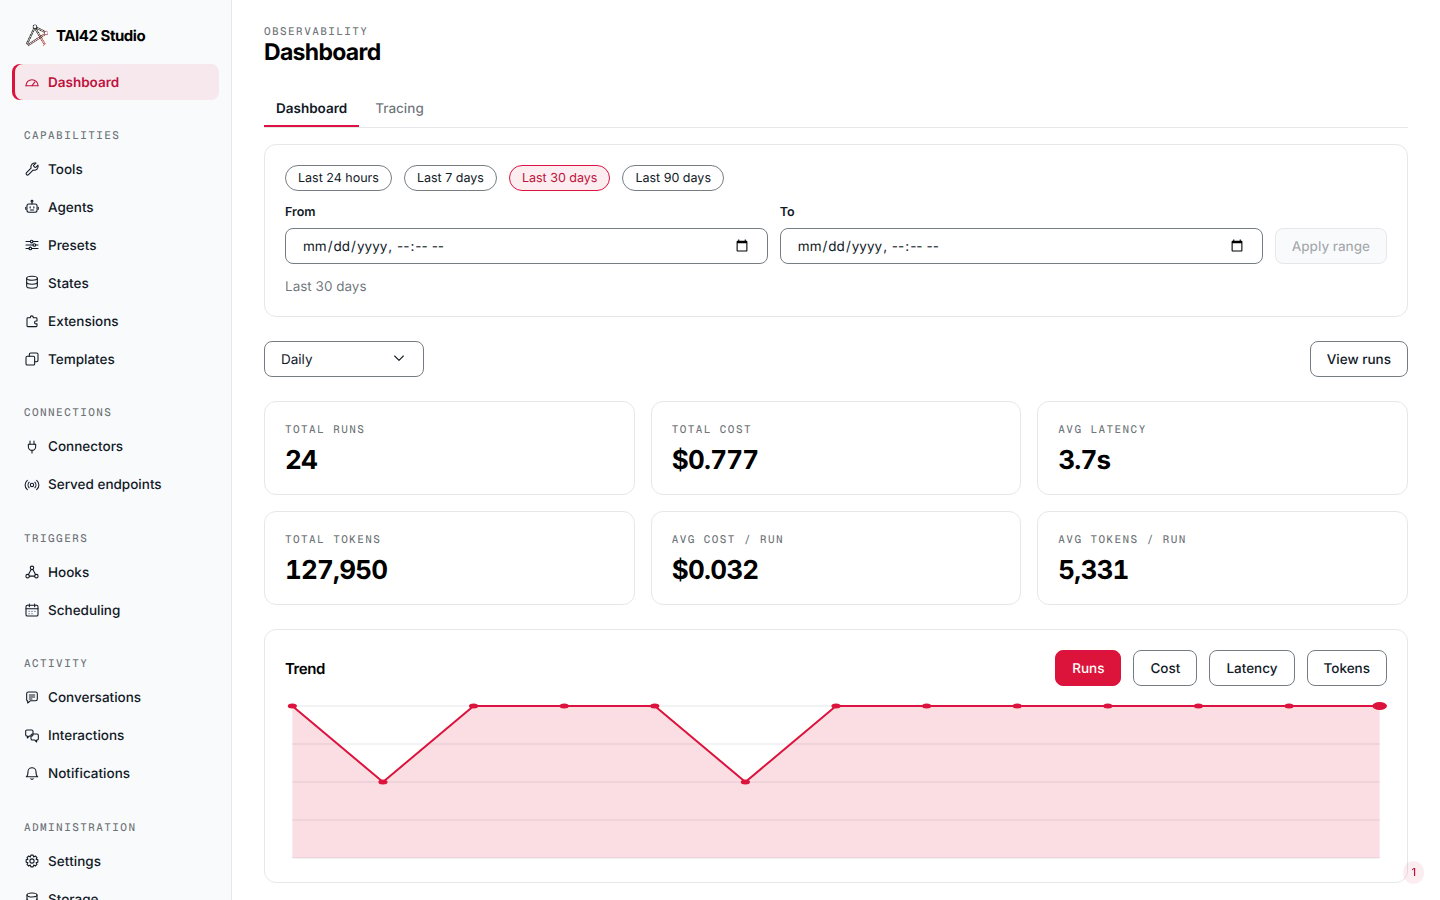
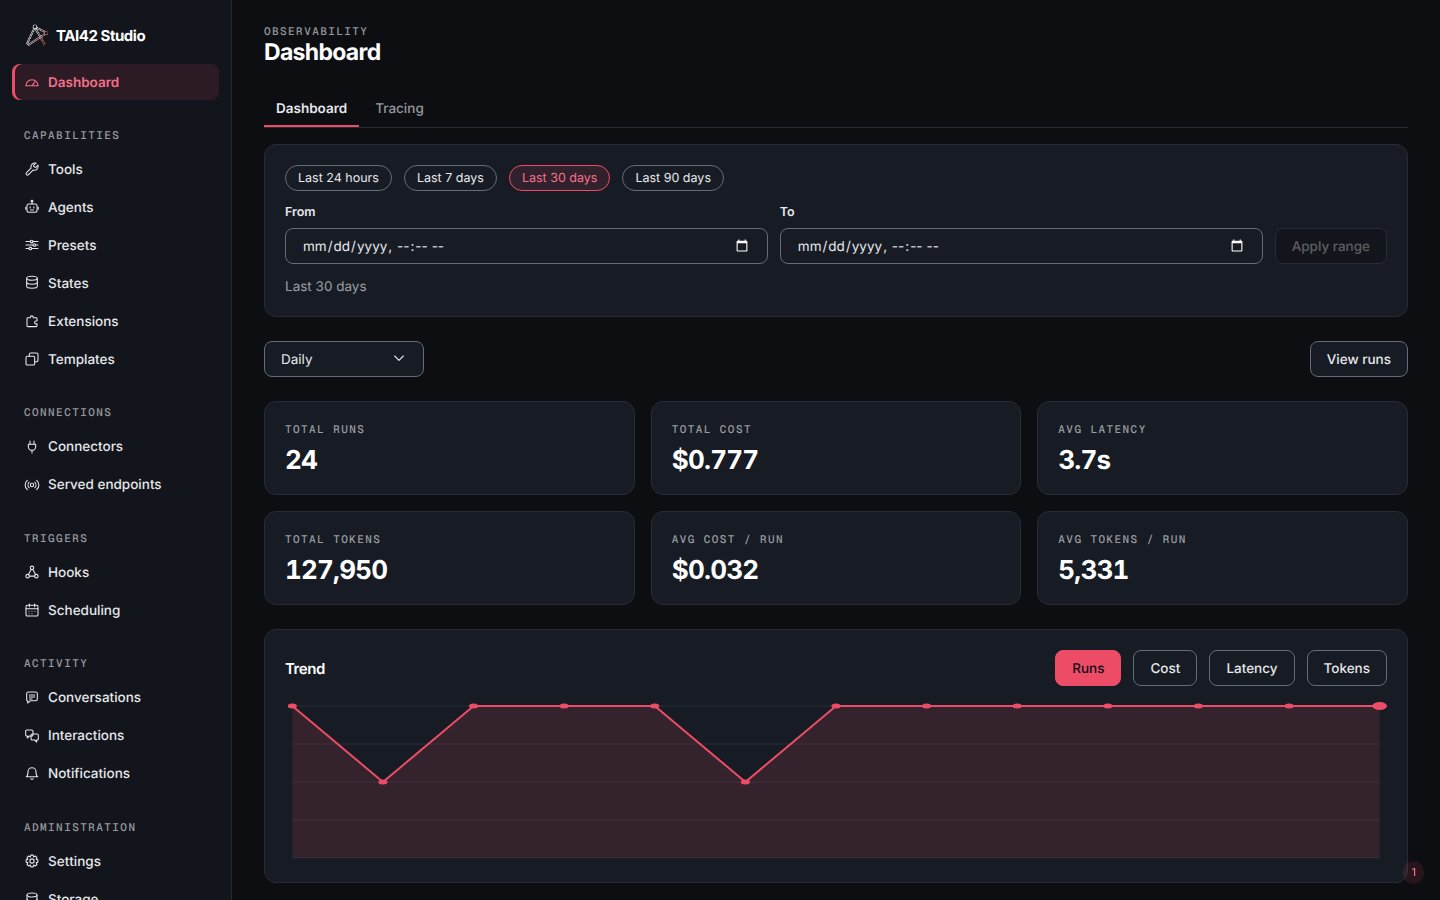
The observability Dashboard: run, cost, latency, and token summaries.
Settings and environment
The Settings and Environment tabs are the deployment’s admin-owned config store: the server’s configuration mode, its settings schema, and the stored environment values — one store holding the deployment’s environment plus each settings class’s values, including deployment secrets such as the connector encryption key. Each subsystem’s settings — connector crypto, engine config, store connections — surface as an editable form. Because that store is admin-owned, both tabs are admin-only; an editor or viewer configures each feature through the feature’s own screen, never here — see user types and permissions. The API keys tab on this screen is separate and self-service: any signed-in user manages its own keys there, regardless of role.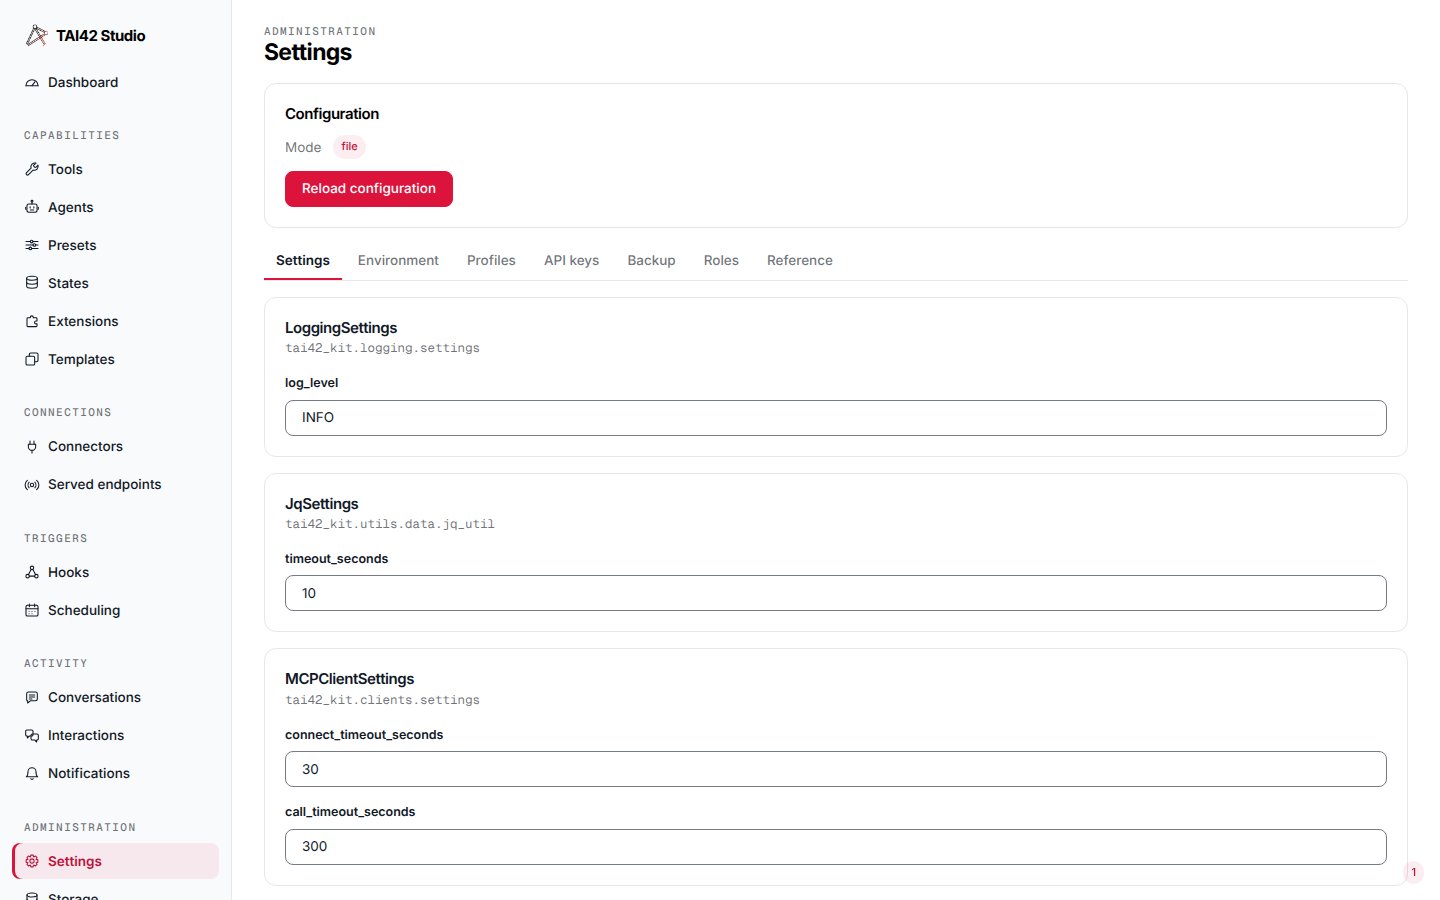
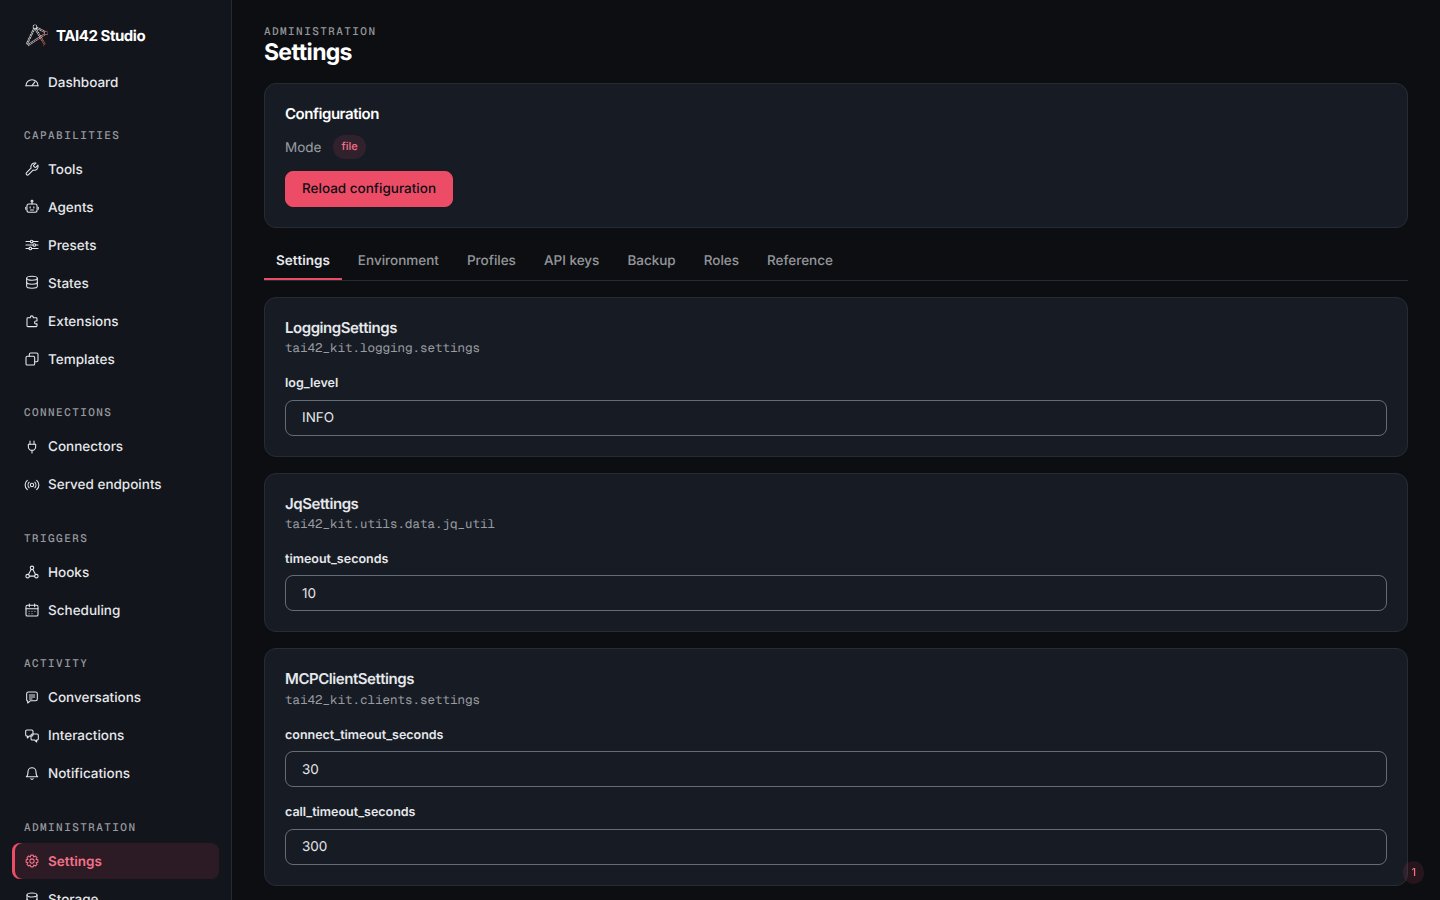
The Settings screen: the server's configuration mode and settings schema.
Live operations
Because the Studio drives the same/api/* surface as the
tai CLI, the management
operations are one run away. From the Tools screen
you invoke reload_tool, remove_tool, or reload_config — the
live operations — to reload a tool, drop one from
the live registry, or soft-restart the server in place. While a reload is in
flight, the API answers dispatch routes with a retriable 503 rather than
serving against a half-swapped registry.
See live operations for the management operations, and
the CLI reference and
HTTP API reference for the routes behind each screen.