

- Capabilities — Tools, Agents, Presets, States, Extensions, Templates.
- Connections — Connectors, Served endpoints.
- Triggers — Hooks, Scheduling.
- Activity — Conversations, Interactions, Notifications.
- Administration — Settings, Storage, Marketplace, Manifest, System.
/api/* surface, and every screen
renders its own loading, empty, and error states rather than a blank page. This
page tours the surfaces you reach most. A Studio plugin adds
its own links to one of these sections, or to a single shared Plugins section
that follows them.
Tools
The Tools screen lists every tool the manifest loaded — your own functions, mounted MCP servers, the standard toolbox, and any extension variants (a_batch or _chain branch appears as its own runnable tool).
Select one to open its run panel.
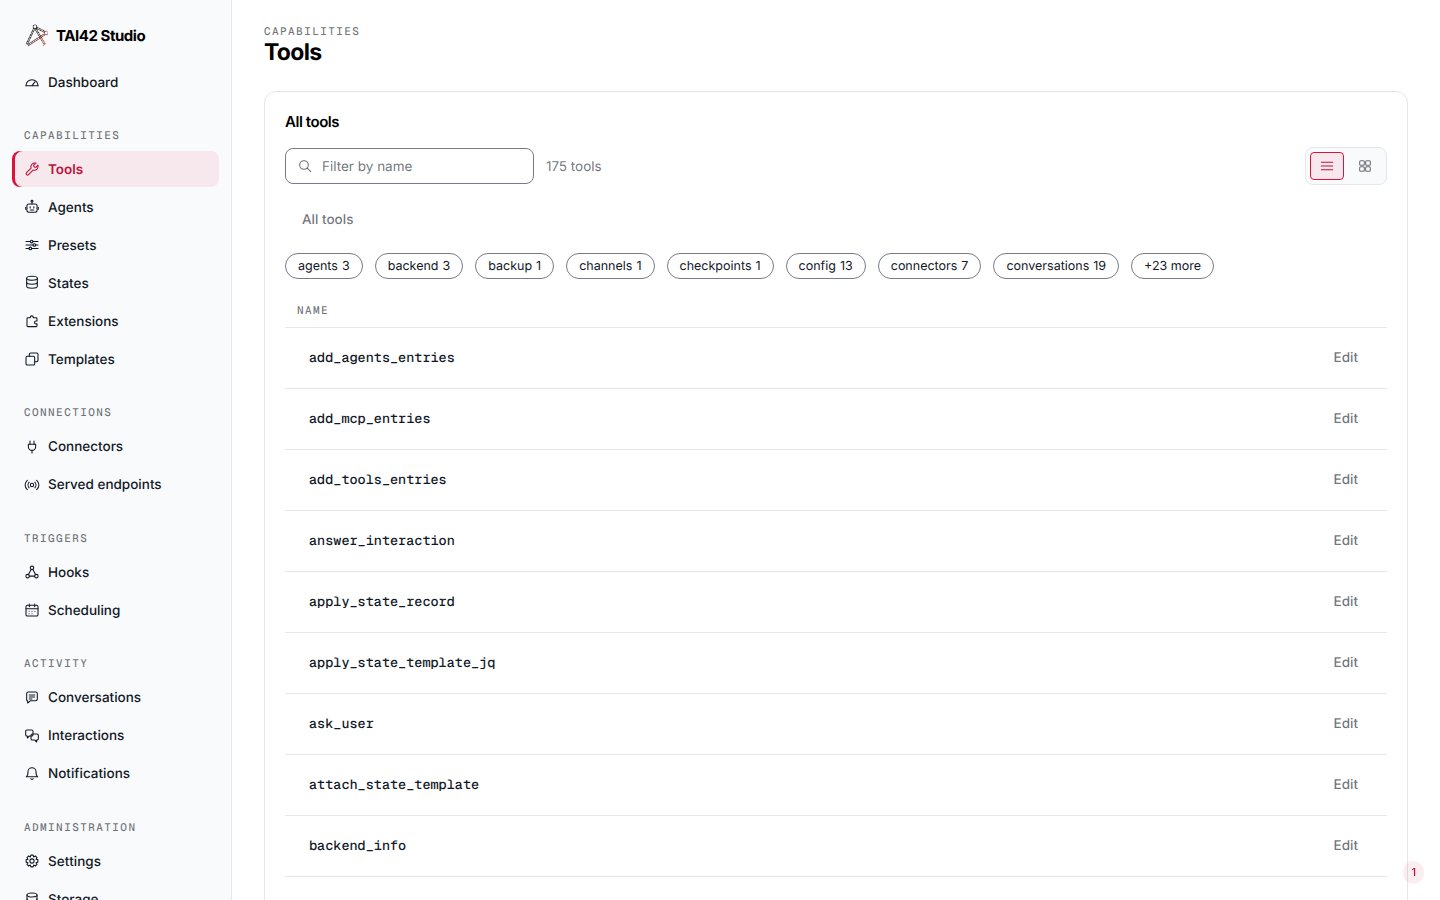
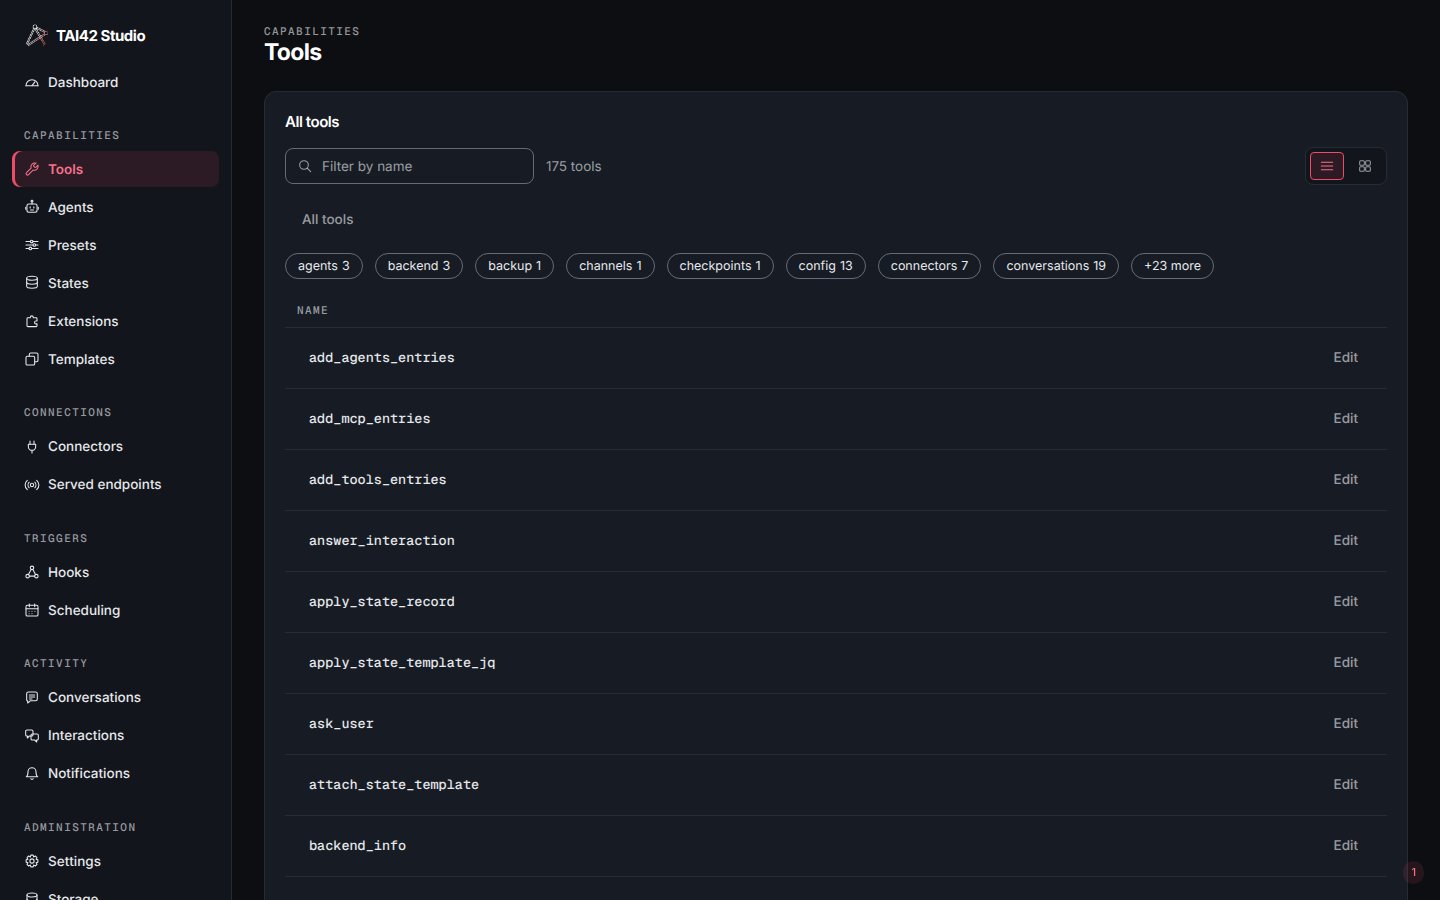
The Tools screen: the master list of loaded tools and the run panel.
tai tool-meta set <tool> --visibility shown); once shown it appears here again. The per-tool edit dialog is the one
surface that edits all four overlay fields: display name, user tags, folder, and a
three-way visibility control (Default defers to the plugin’s declaration,
Shown forces it visible, Hidden forces it out of the lists).
Each folder row carries Rename and Move actions; Move offers the folder
tree as a parent picker (with inline create) and excludes the folder and its own
descendants, so a folder can never become its own ancestor. Both appear only for a
session that can write the overlay.
The screen also carries the app-tool live-registry admin card — Reload re-registers
one app tool and Remove detaches it from the running registry, each named by its
reloader kind and name and applied across the fleet. Reload is non-destructive;
Remove asks the house confirm first. The card renders only for a session whose
projection reaches those fenced doors.
Agents
The Agents screen lists the agents the manifest registered, each with a Run entry that opens its run panel. Compose agent authors a new agent as a saved spec — a prompt, a tool selection, and presets baked over a base agent — that versions and rolls back like a preset; the authored-agents panel is empty until you compose one.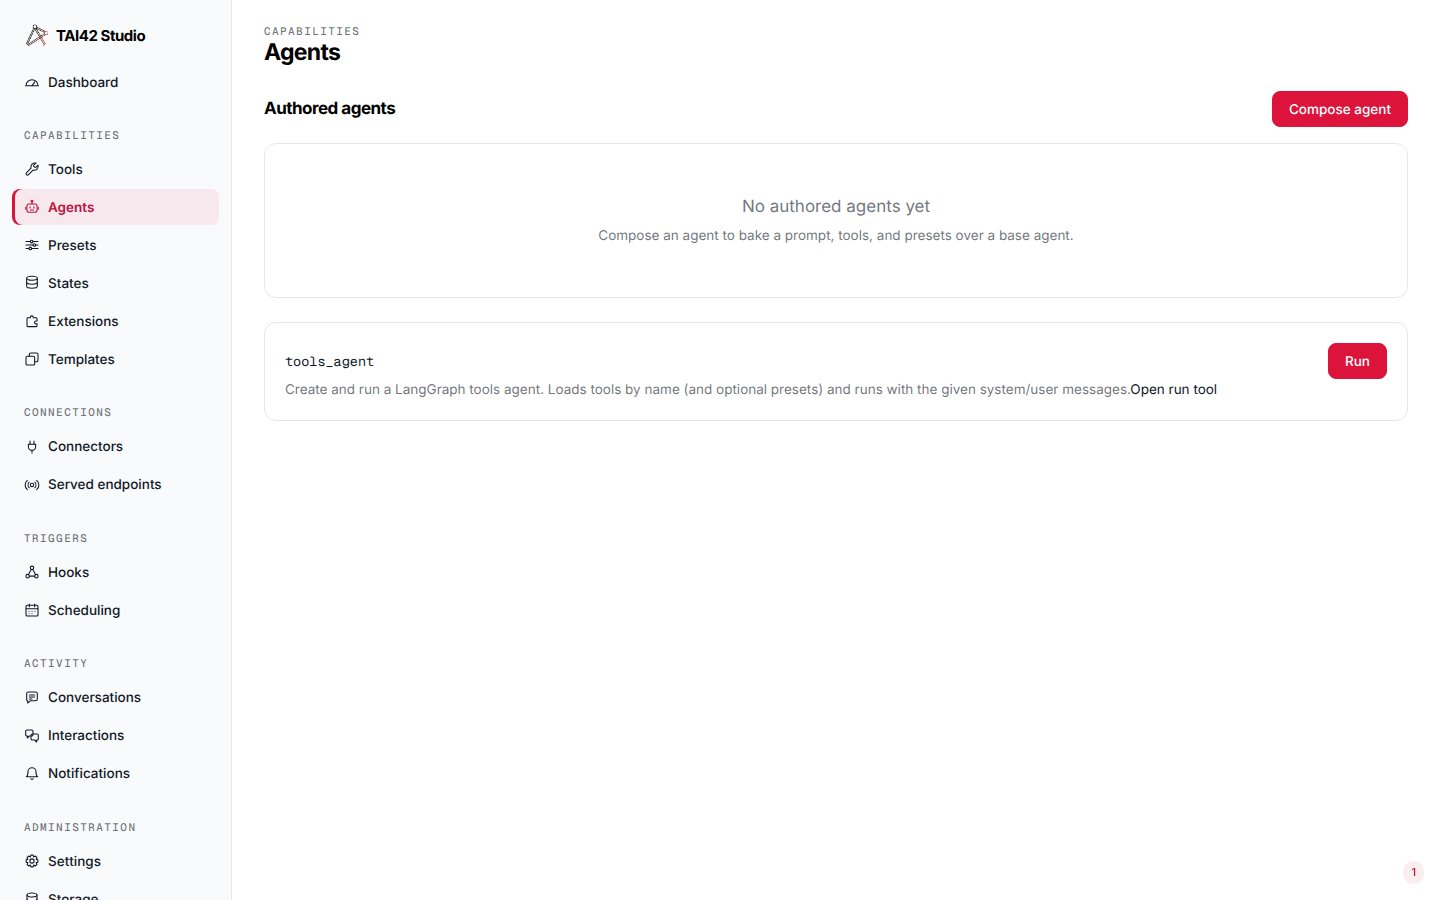
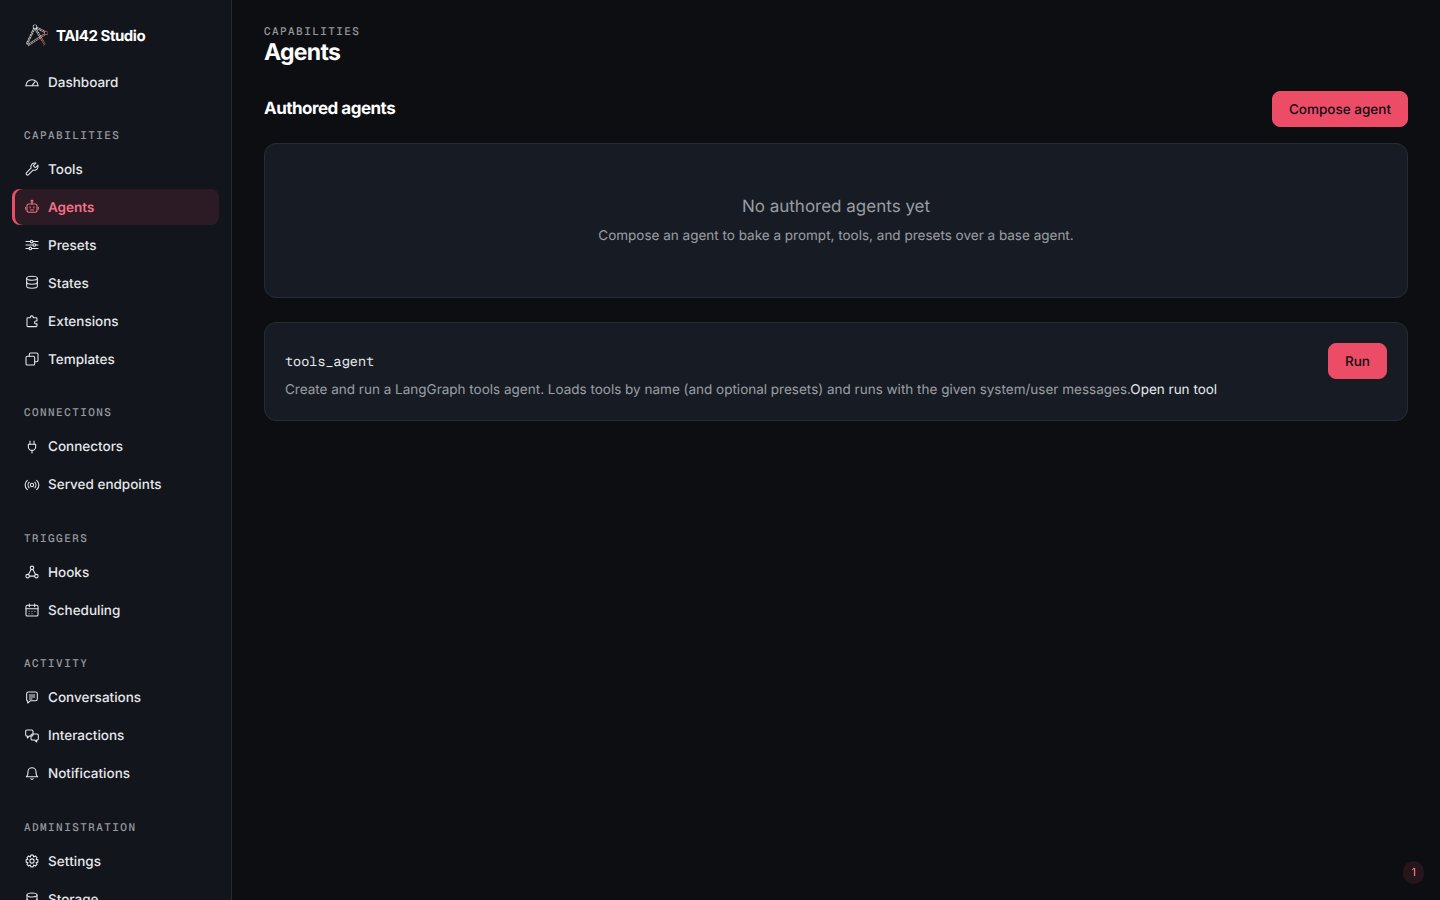
The Agents screen: the authored-agents panel above the manifest-registered agents, each with a run entry.
Extensions
The Extensions screen is where you attach a clip-on power — a chain, batch, or monitor extension — to a tool, and browse the extension catalog of variants already registered. Pick a tool in the apply form to view and edit its combos; each catalog entry lists its variants and their transform.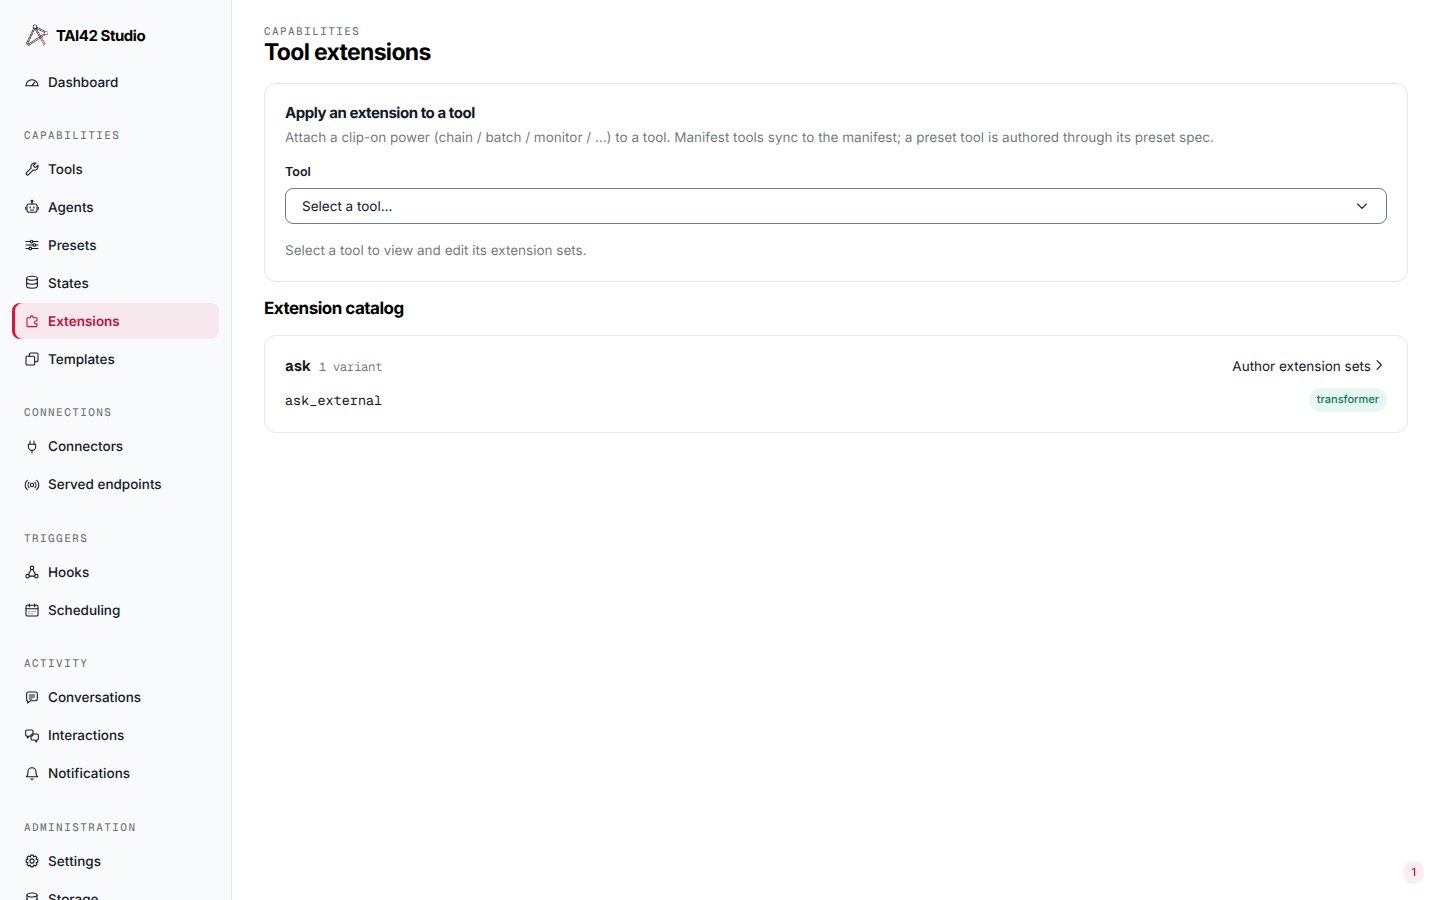
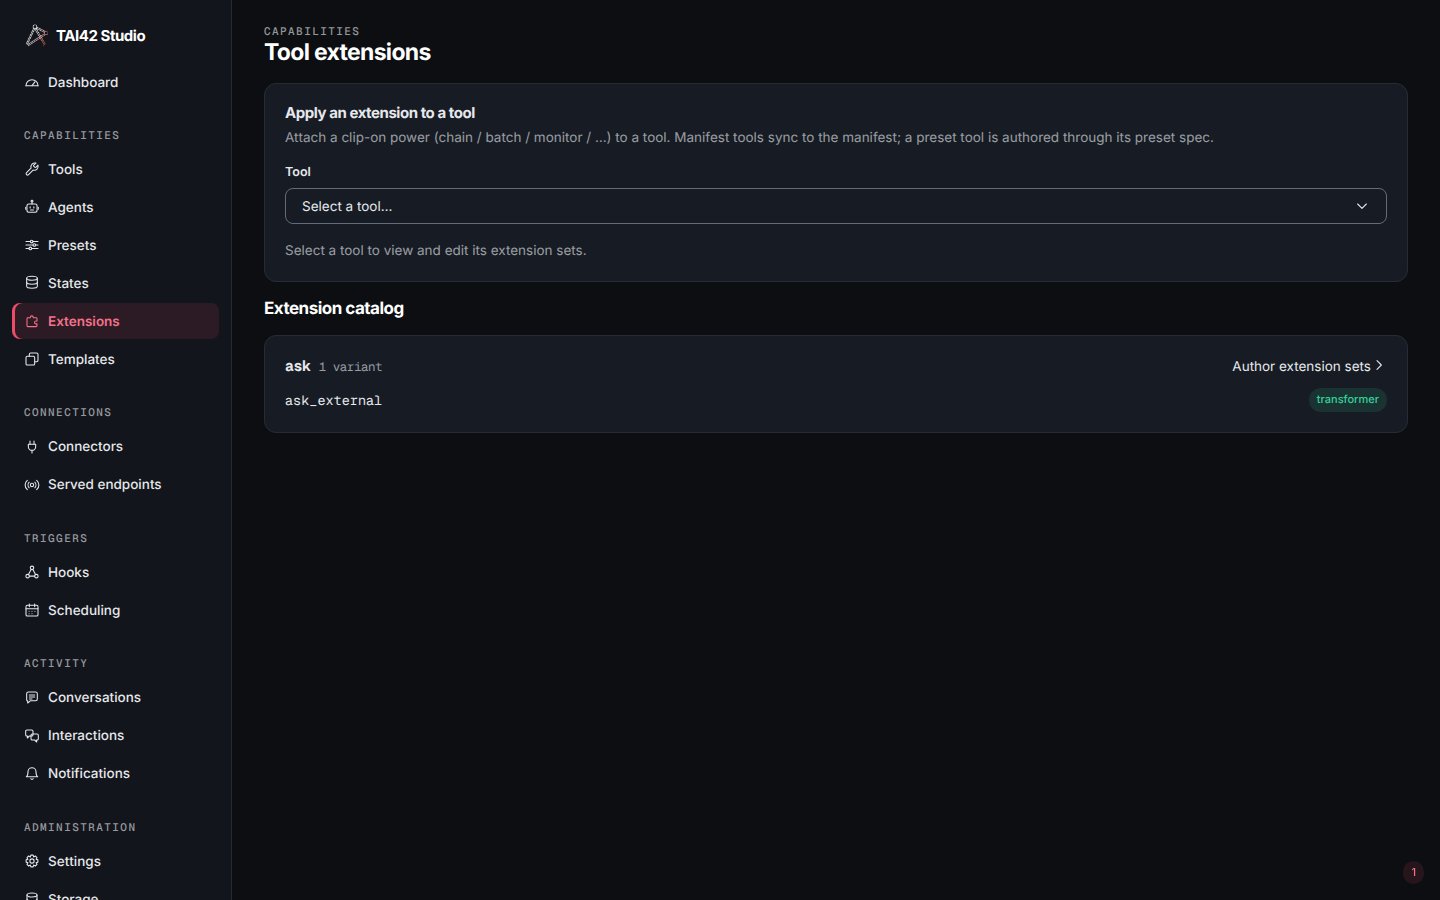
The Tool extensions screen: the apply-an-extension form above the extension catalog of registered variants.
Templates
The Templates screen browses the stored resources the ResourceManager serves — jinja templates and other content held in the configured storage backend. Select one to view and render it. The upload form writes new resources two ways: a Text mode types a single template inline, and a Files mode picks many files at once — each file becomes a template keyed by its name. A files upload checks every path for a conflict up front and blocks the whole batch before writing if any name already exists or repeats, so a bulk upload never half-overwrites the store. Each folder row carries a delete affordance — a destructive confirm that removes every template filed under that prefix — and a selected template’s detail deletes it behind its own confirm.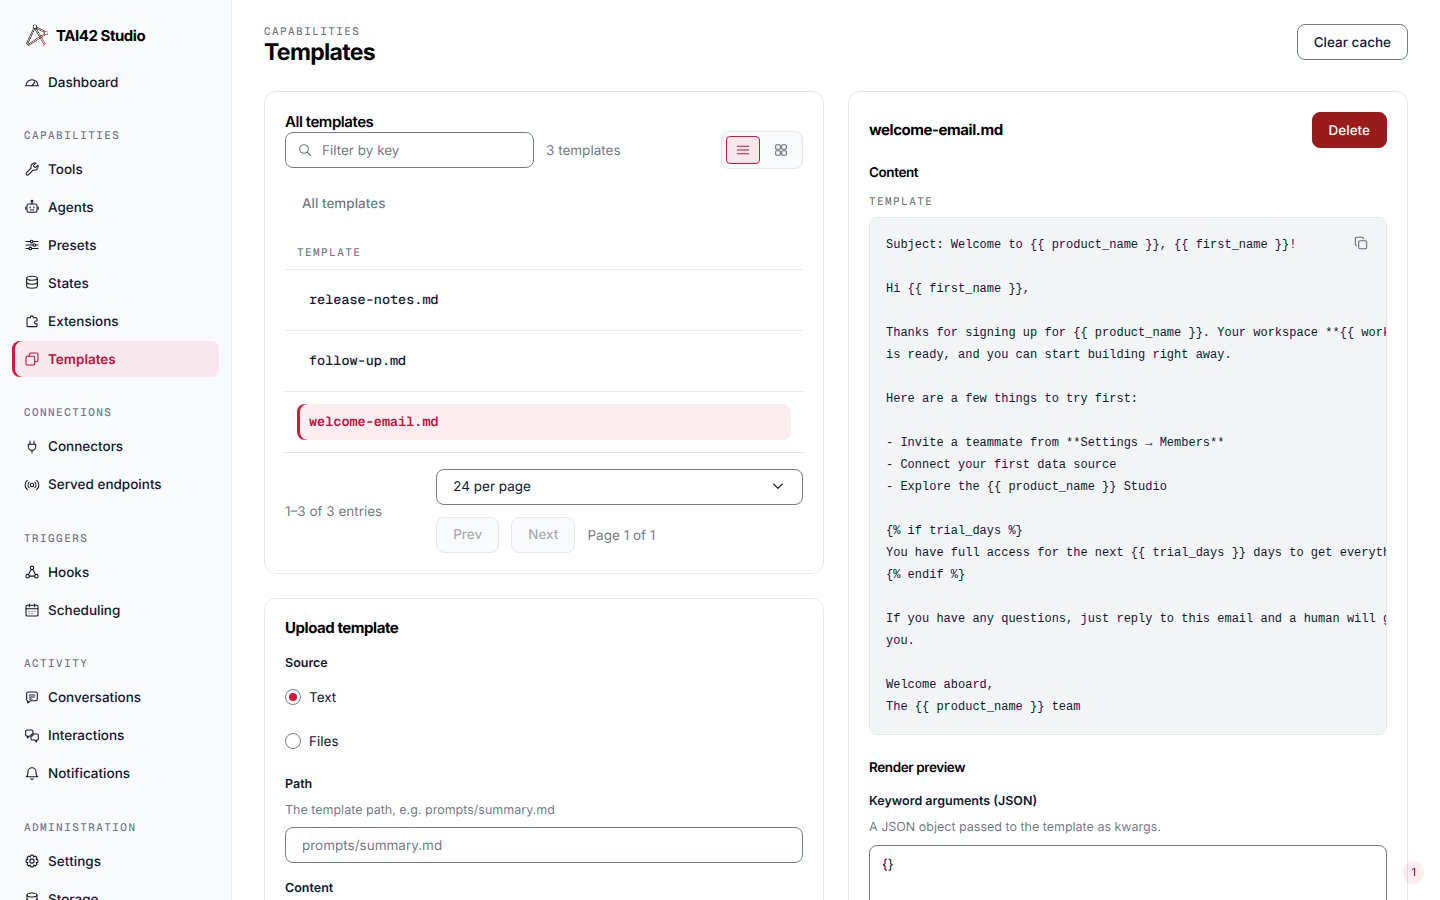
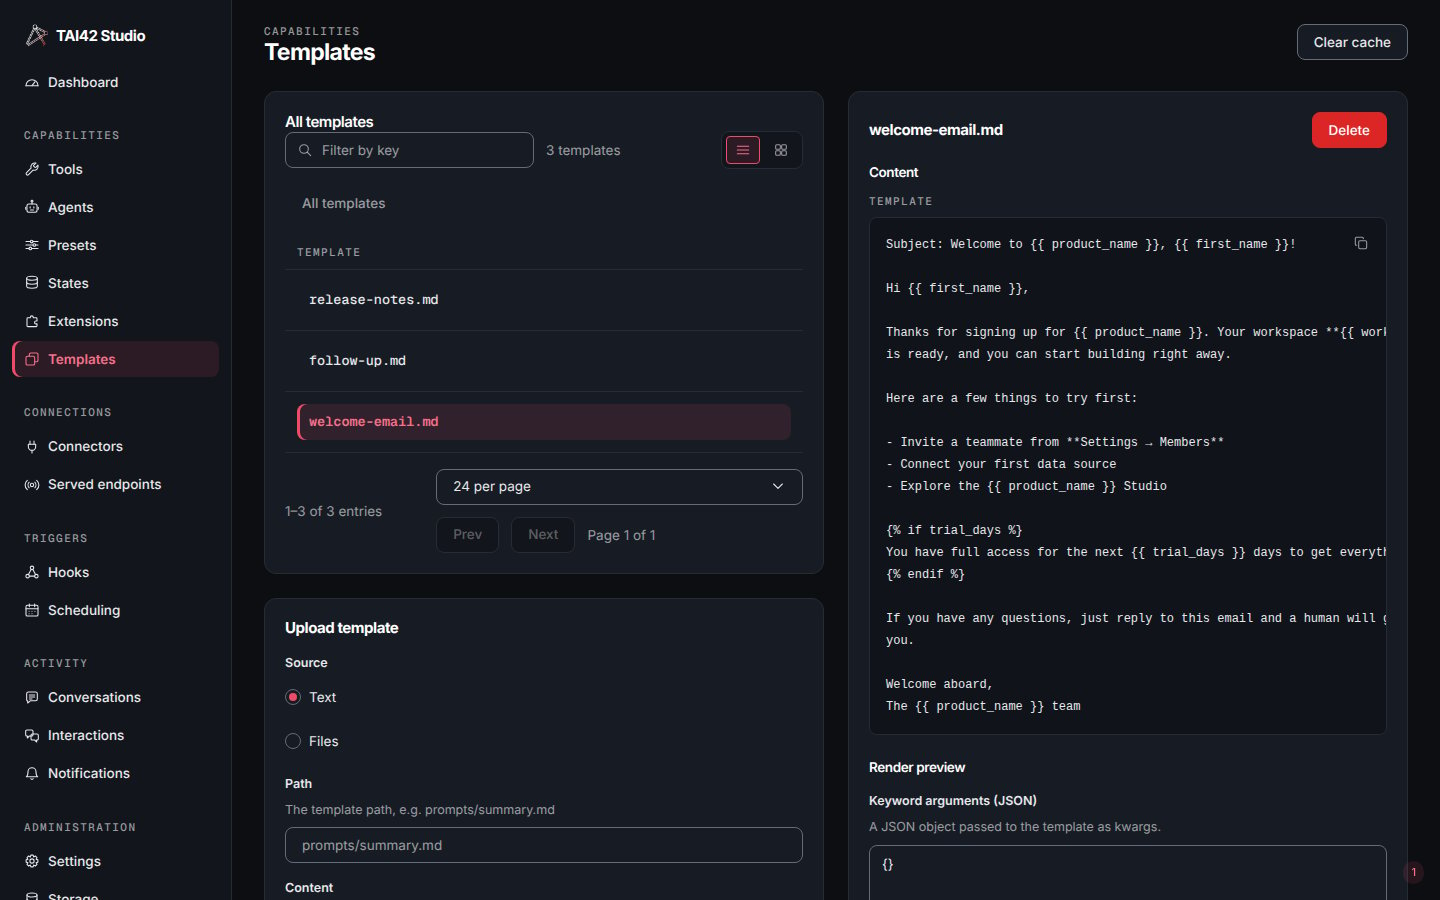
The Templates screen: stored resources with a viewer and an upload form.
States
The States screen drives the platform state store — the declared documents every door reads and writes per subject. It lists each declared state with its subject kinds, record and consumer counts, and last update, above a Declare state action and an Upload action that routes a.json file to the
state or state-template upload door by its kind.
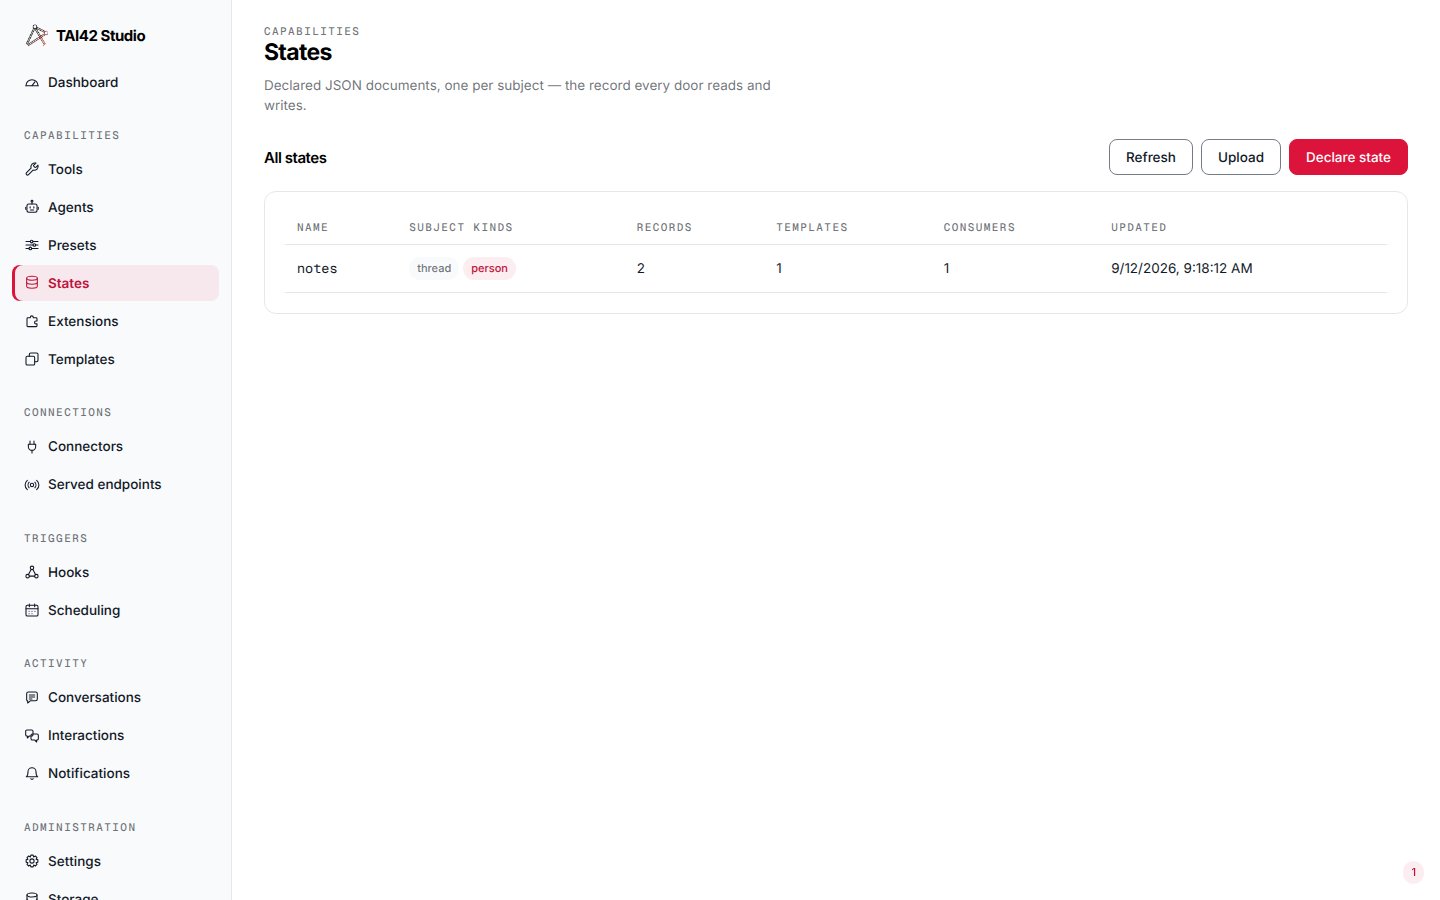
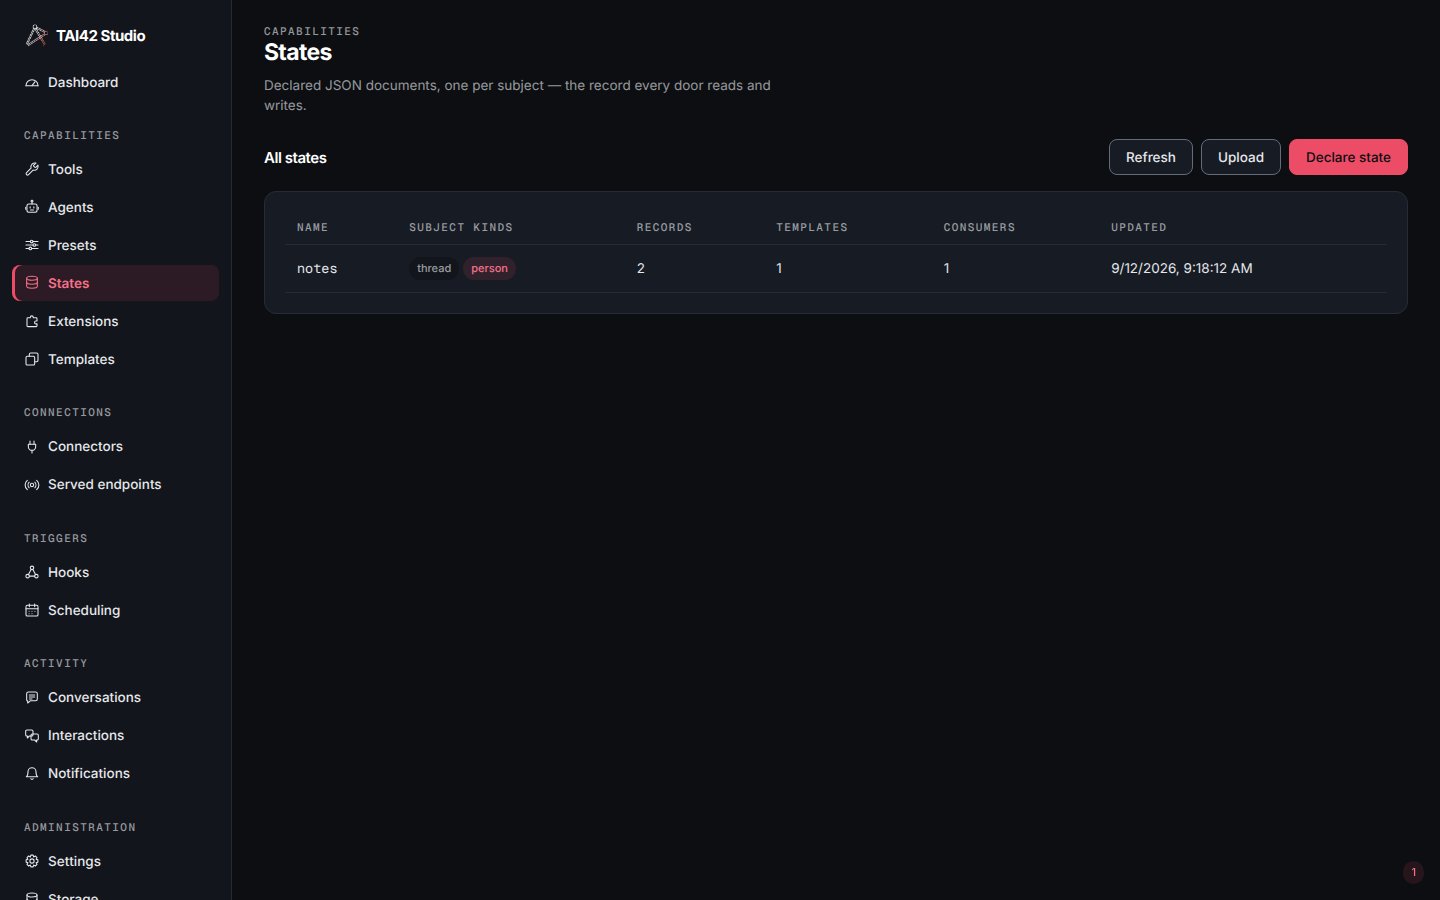
The States screen: declared states with their subject kinds, record and consumer counts.
person keys are person ids from the conversations identity store) and the
retention setting. Once a state has records the editor accepts only additive
changes: removing or changing an existing field is refused.
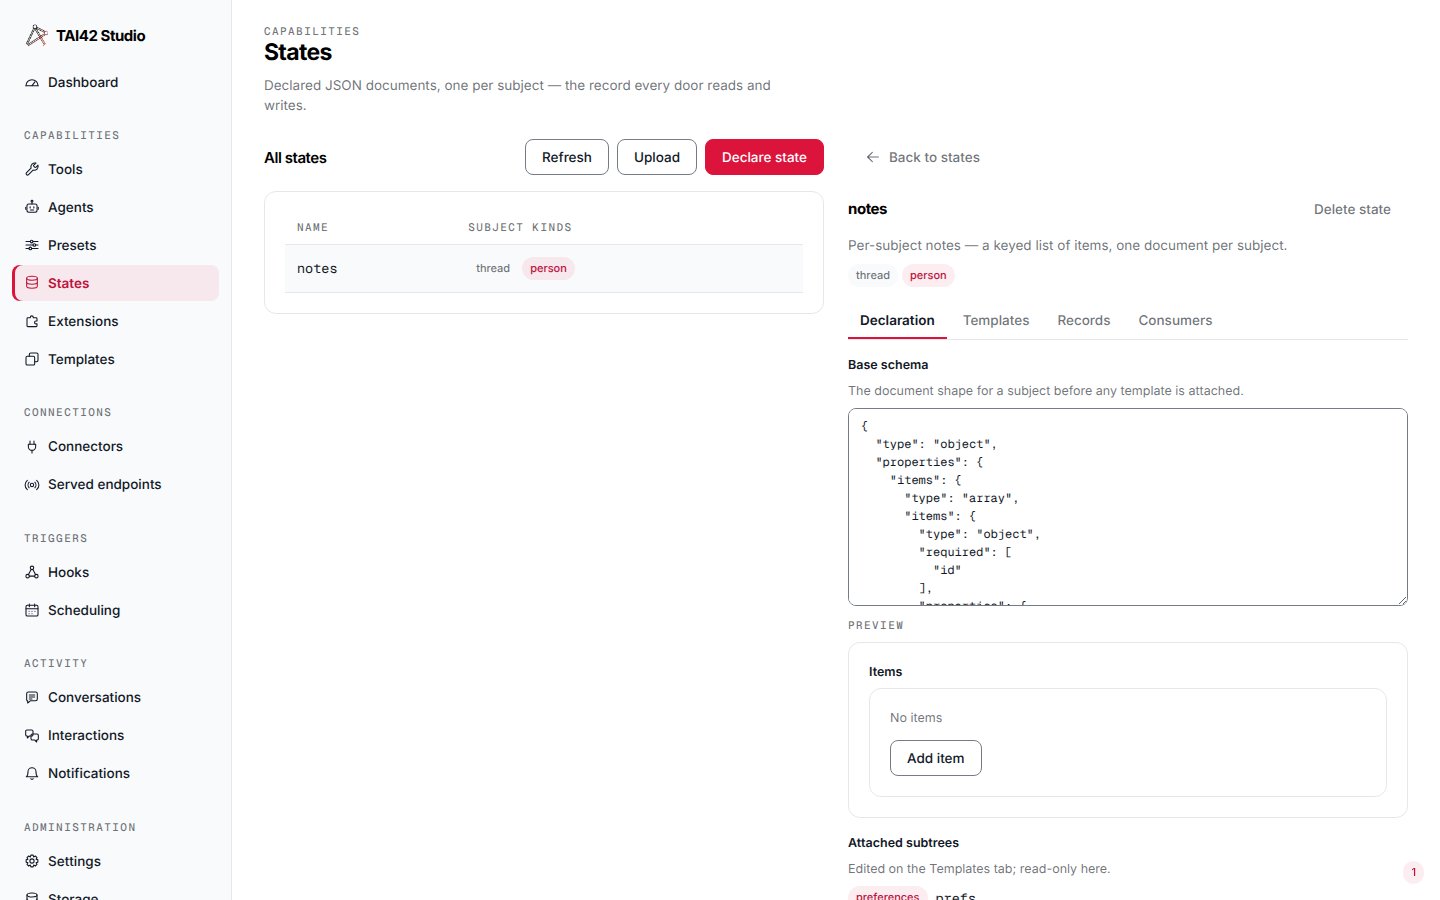
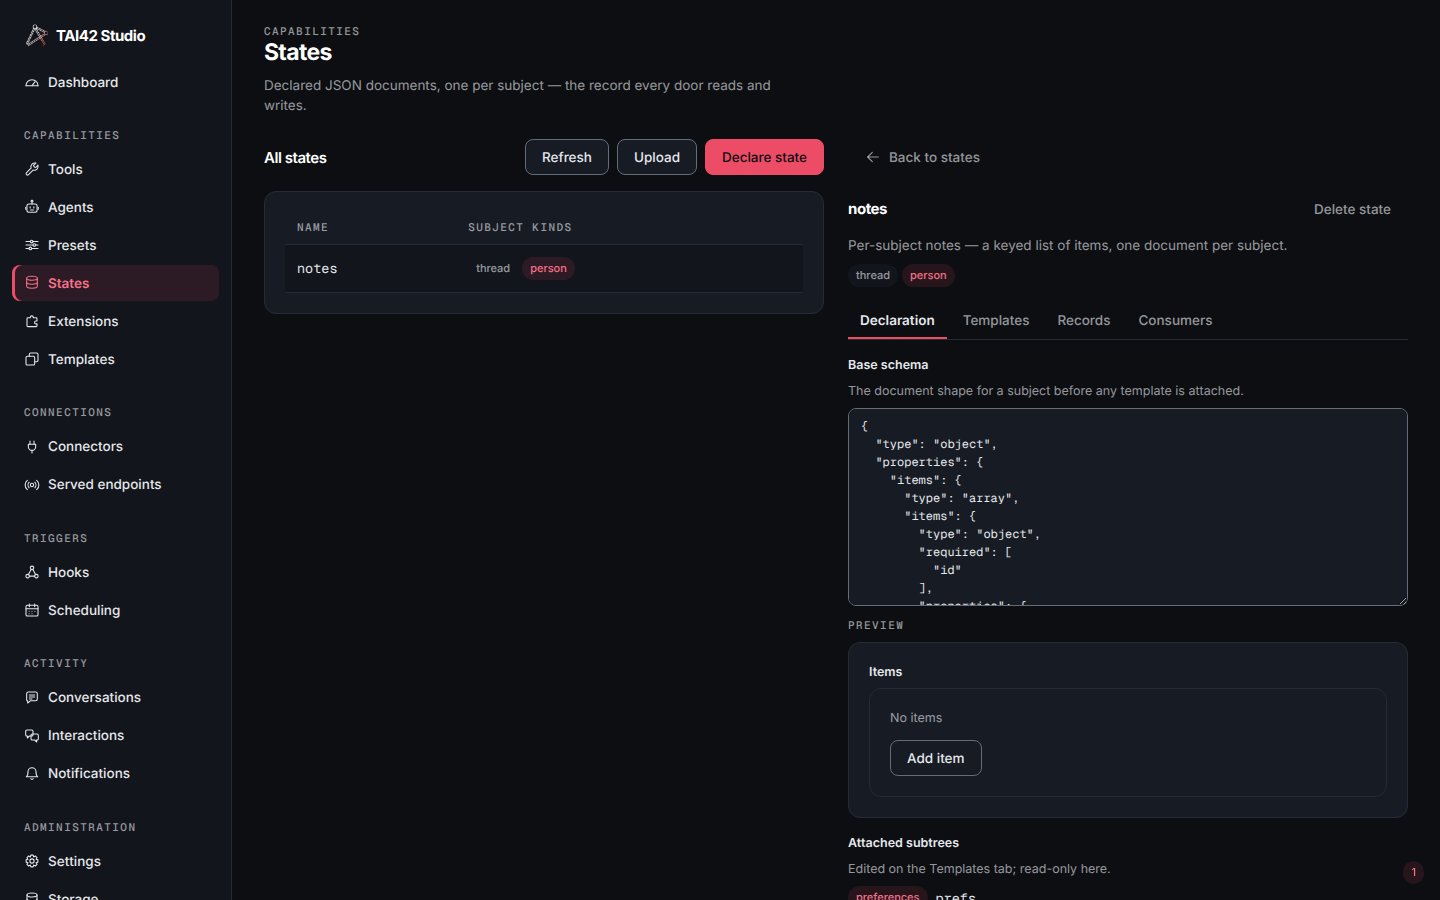
The Declaration tab: the base schema as a field tree beside the subject and retention settings.
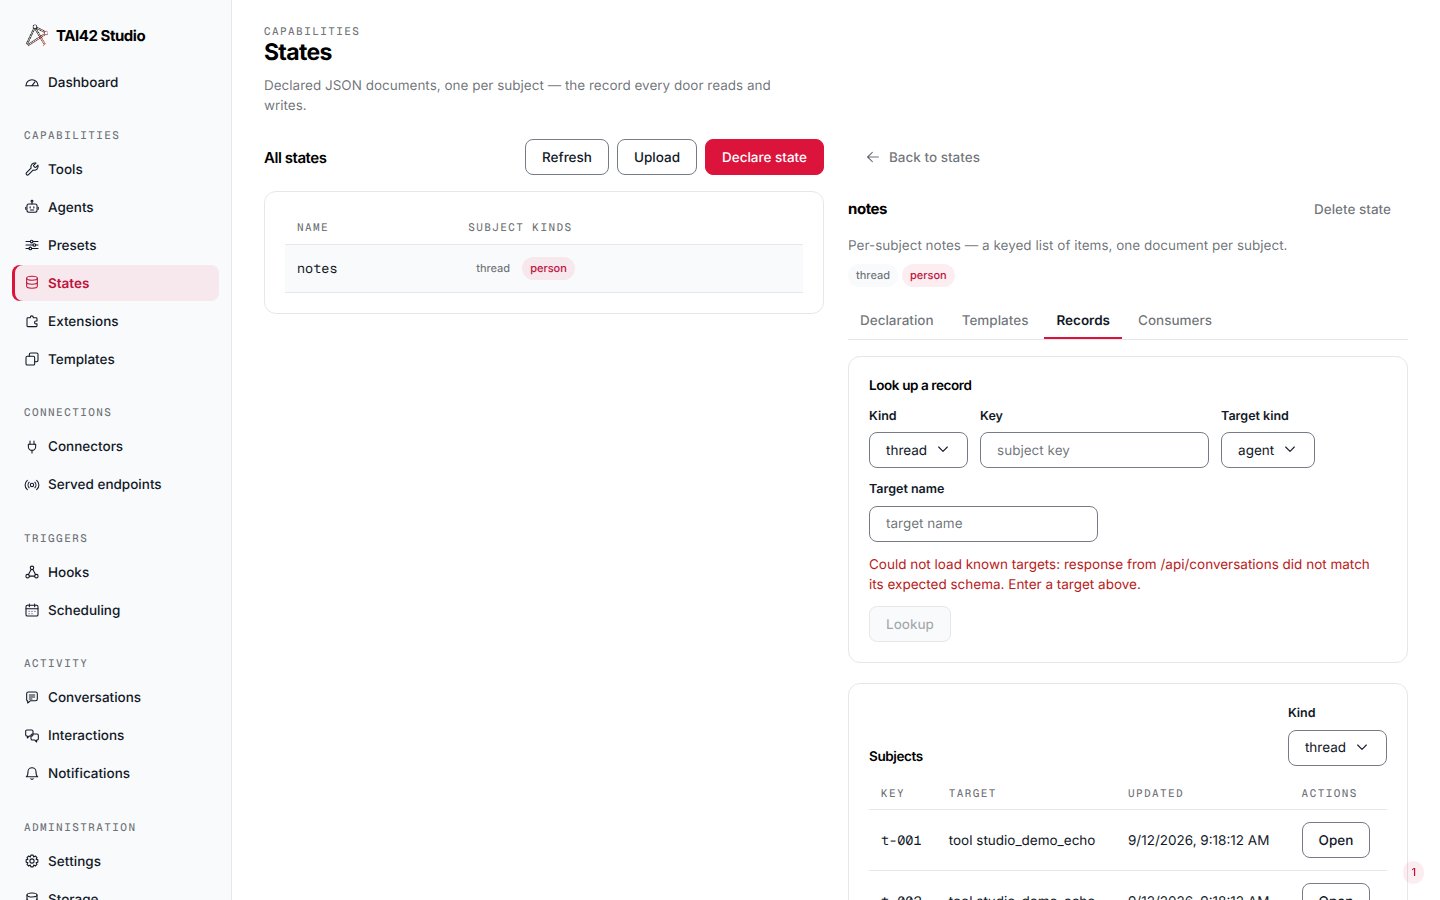
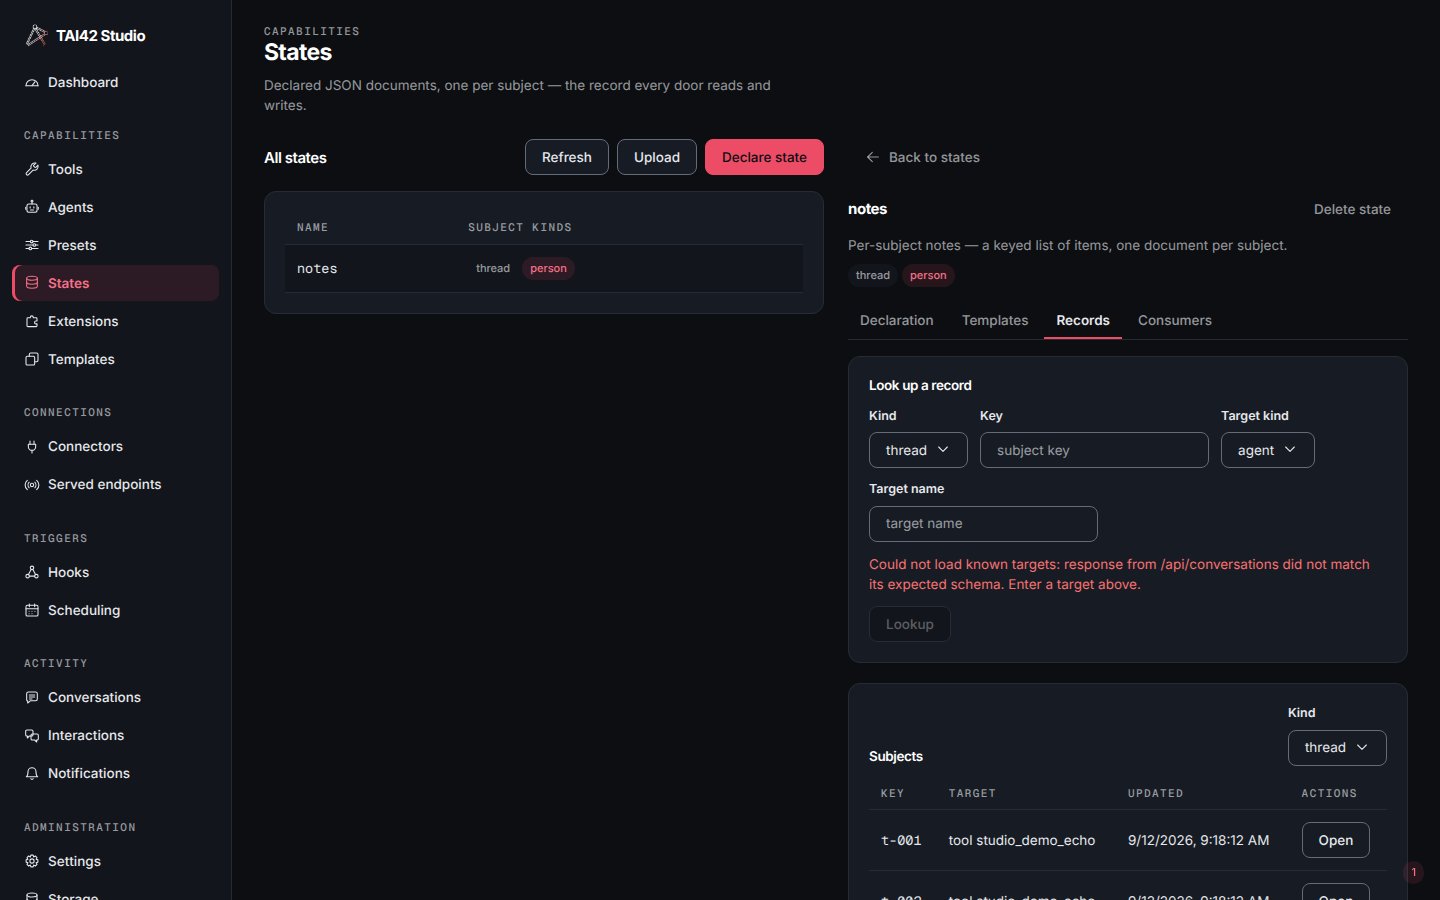
The Records tab: the subject lookup form above the state's subjects.
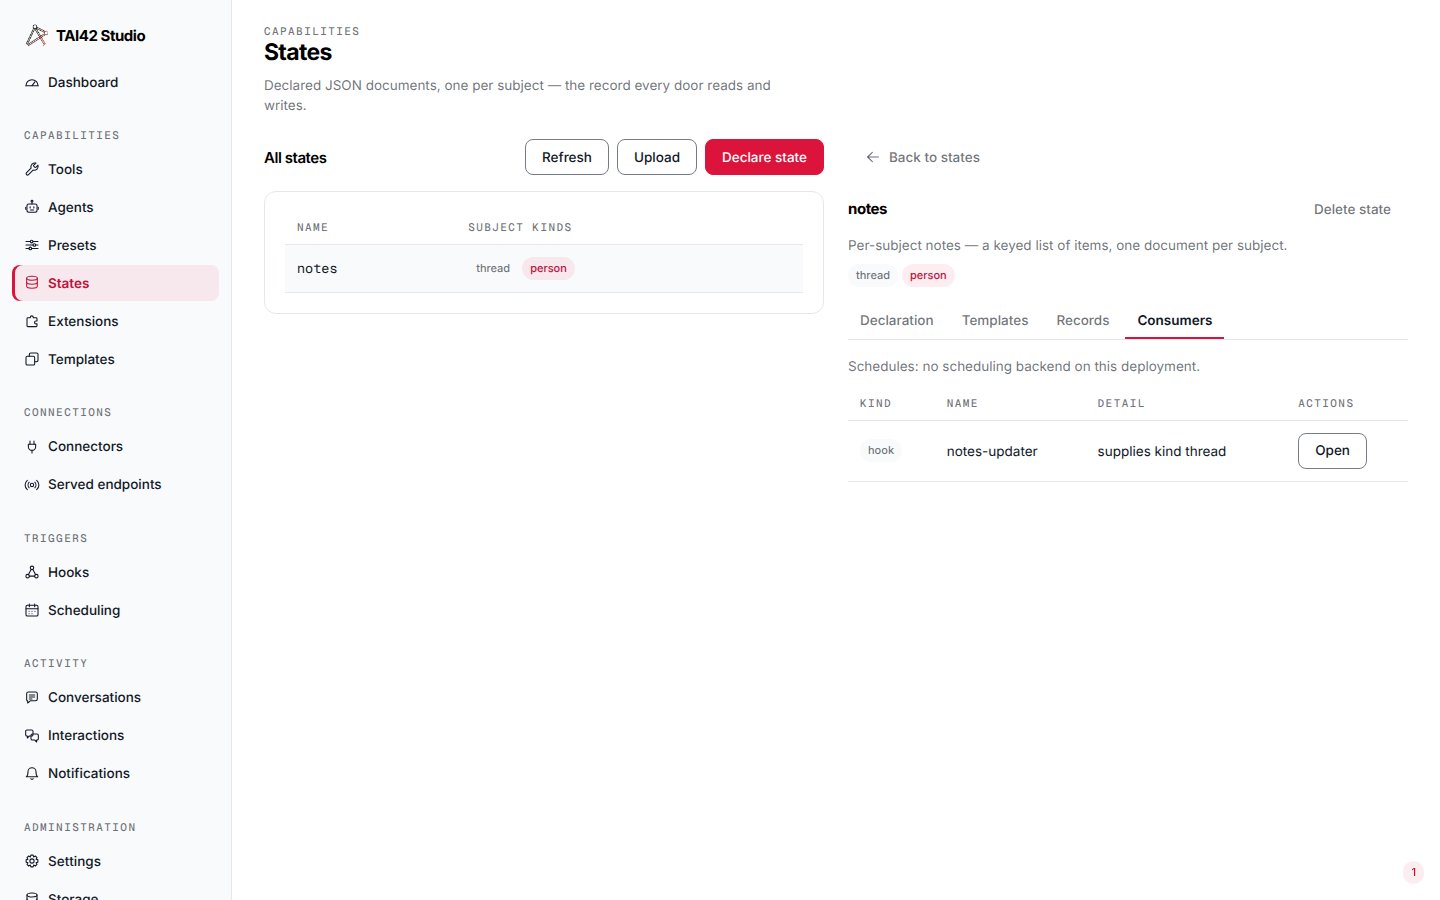
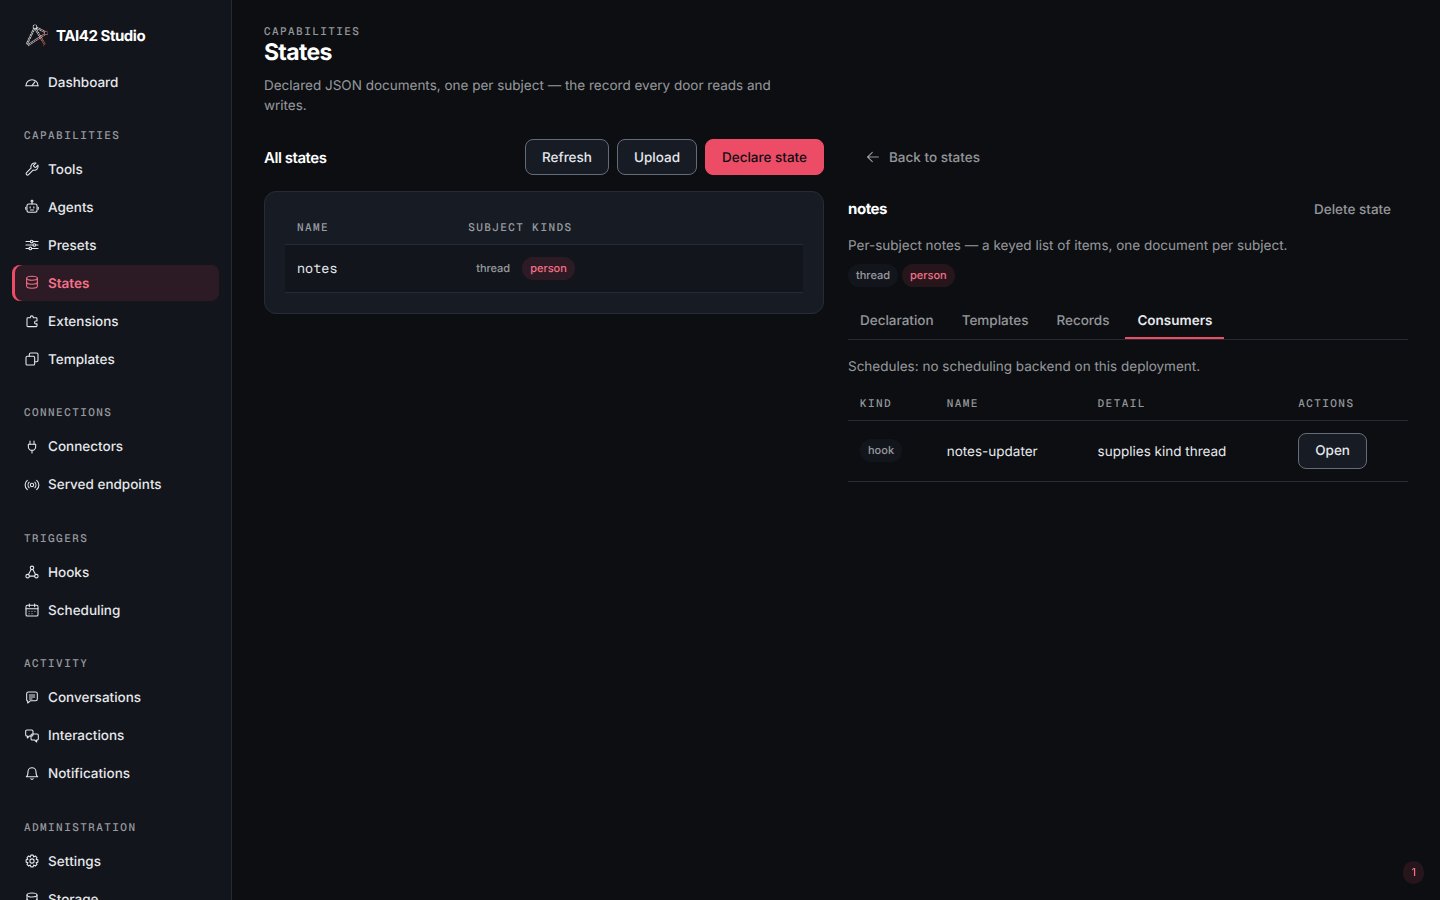
The Consumers tab: everything that binds the state, each with an open link.
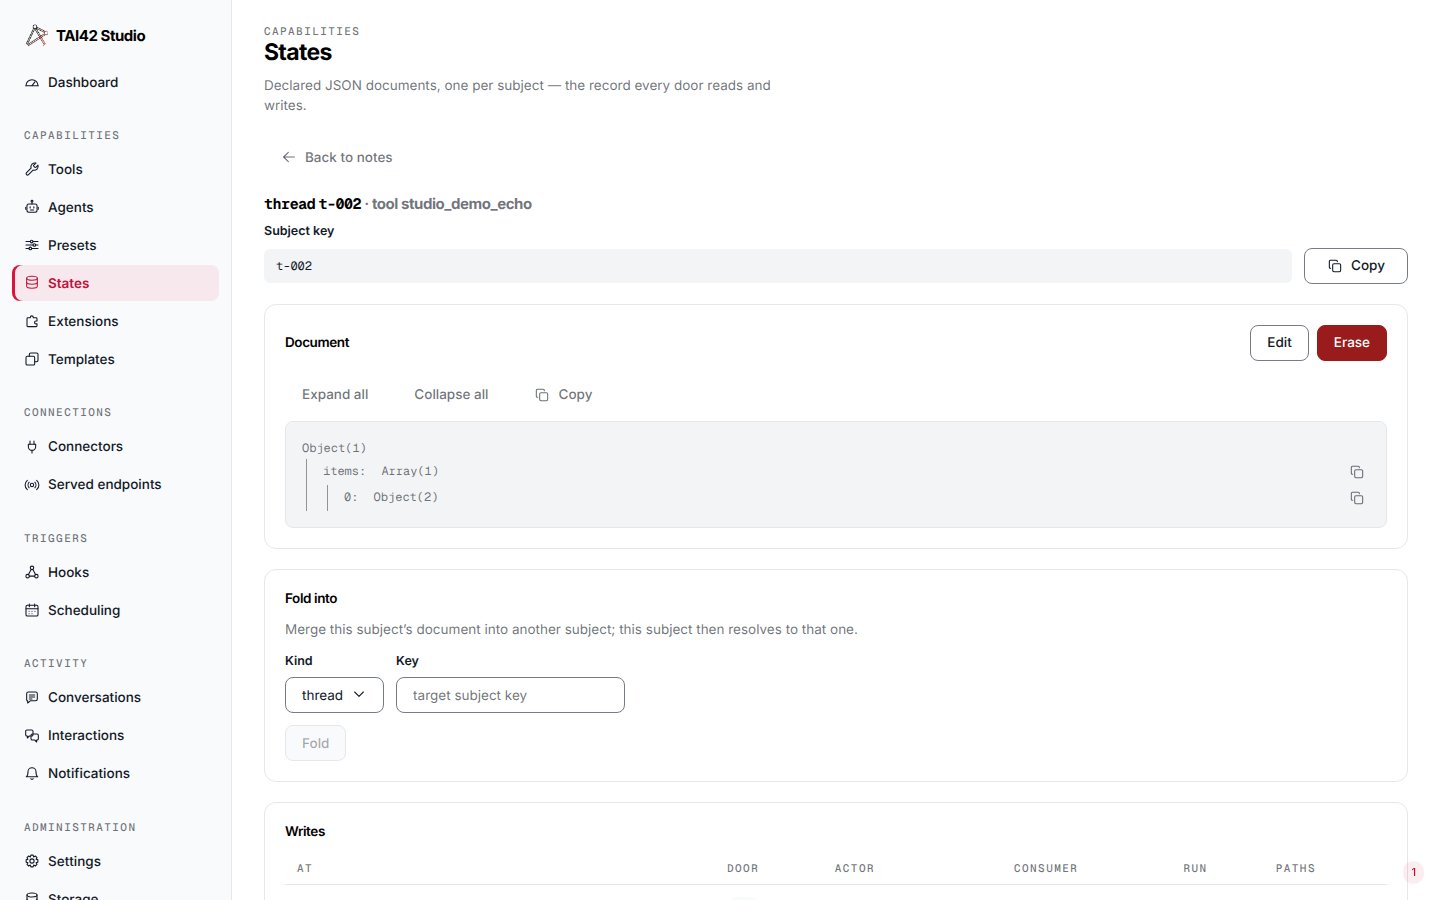
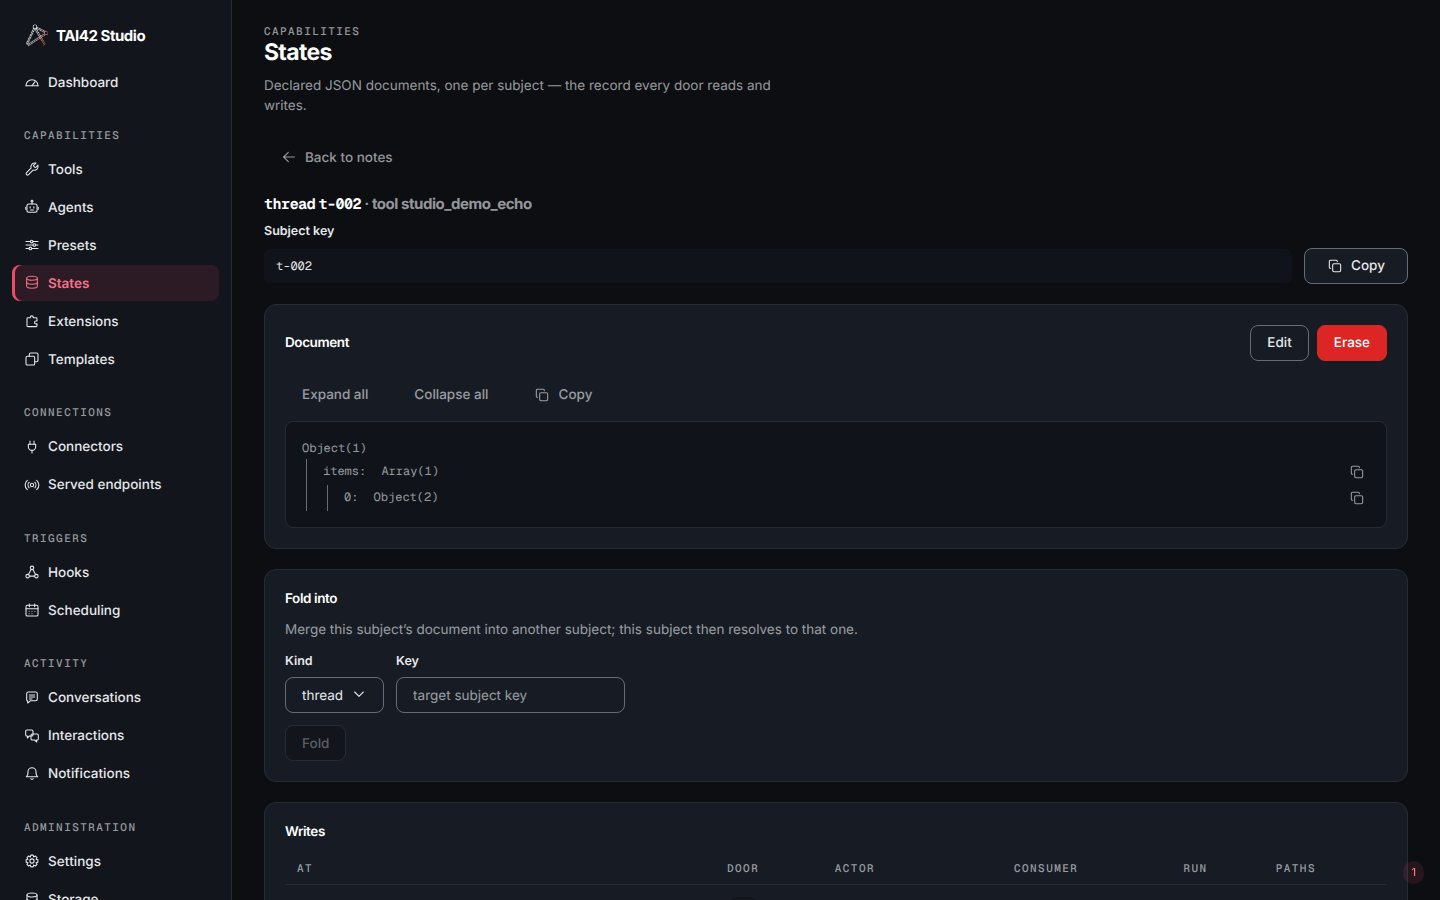
The record page: the subject's document beside its fold action and its writes audit table.
Dashboard
The Dashboard reads the server’s monitoring backend — run counts, cost, latency, and token totals over a time range, with a per-model breakdown and a trend chart. The demo instance below is populated from a monitoring backend seeded with example runs; with no backend registered, it renders a clean empty state instead.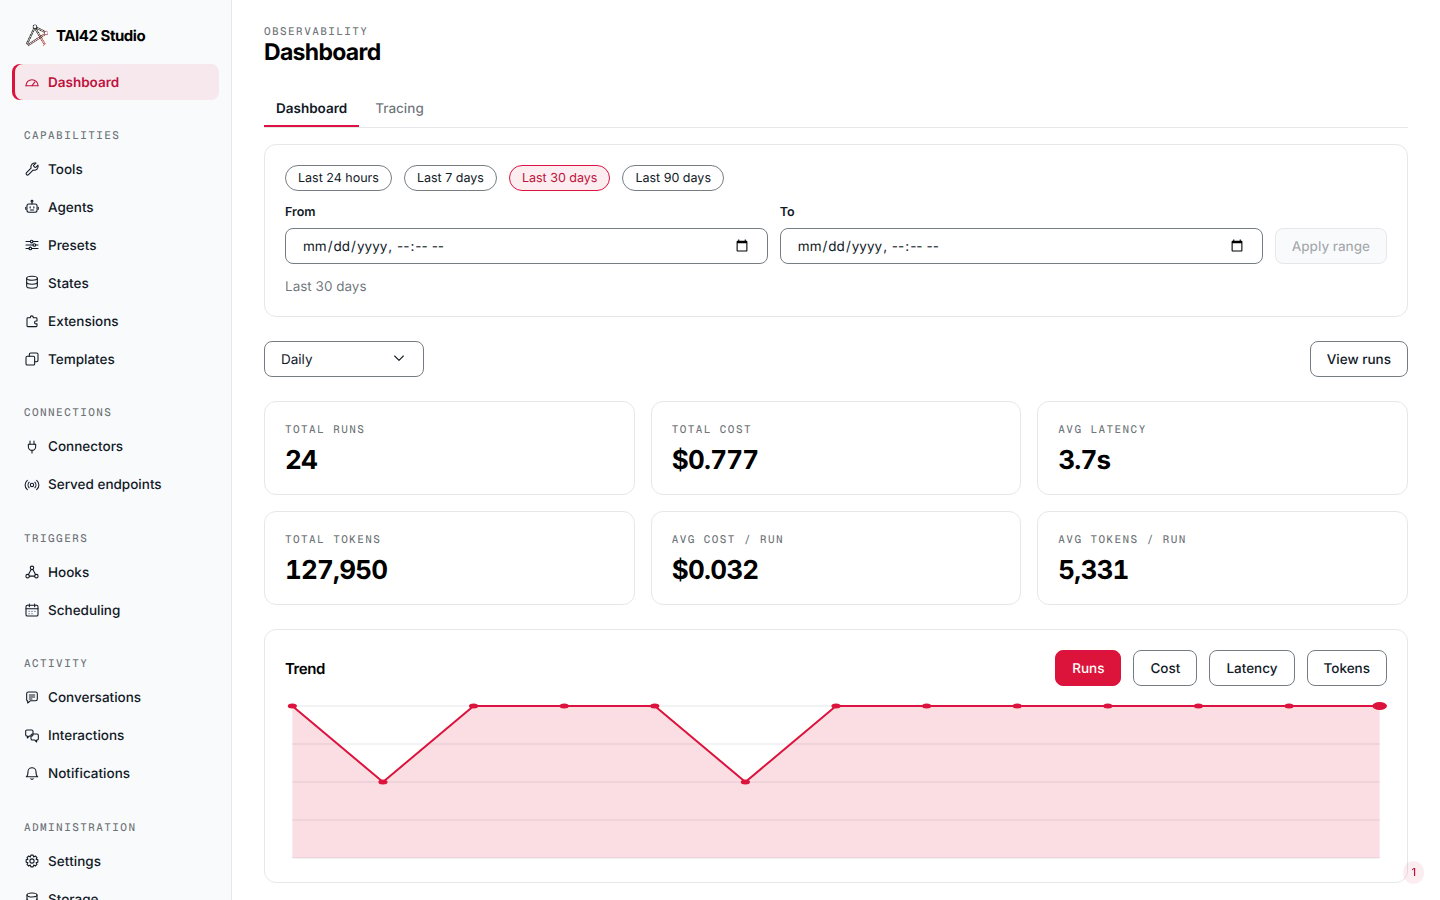
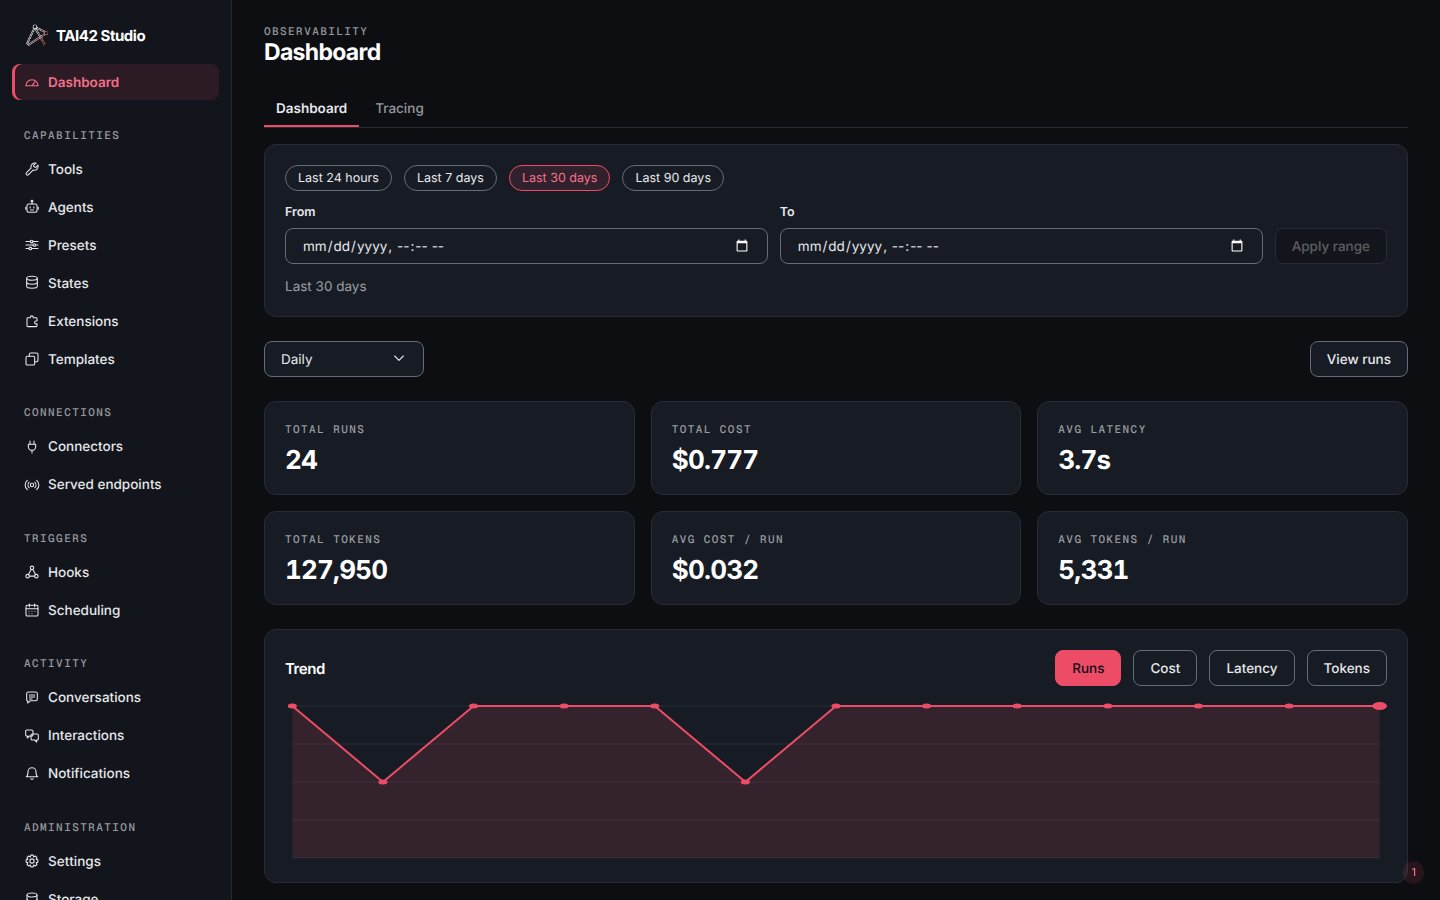
The observability Dashboard: run, cost, latency, and token summaries.
Conversations
The Conversations screen, under Activity in the sidebar, is the operator’s window over the conversation bridge — every route, whichever door it listens on, in one place. It both manages routes and monitors their traffic, and drills down in three levels, each of them a URL you can share or bookmark: the route picker, that route’s threads, and one thread’s transcript. The landing carries three tabs — Routes, Per-target configs, and Failed deliveries — so only the open one reads its door; on a no-backend deployment each reports its own off state rather than three stacked empties. The Routes tab is the route picker: it lists every route with the door it answers (a channel’s registry name, or the authed API), the identity that medium reaches you at, and the agent or tool a turn runs. Create route opens an upsert dialog, and each row edits or deletes its route. The dialog authors the route through a schema form whose fields follow the target and door — anagent target hides the tool-only
jq fields, and each door shows only its own delivery fields. The payload_expr and
reply_expr fields render the visual jq editor in place. An
api-door save that sets a callback_url mints a fresh callback_secret and reveals
it exactly once in the dialog under a loud caption — every such save rotates it and no
door can re-read it, so copy it then; a channel save and a poll-only api save (no
callback_url) carry no secret and close straight away.
Selecting a route opens its threads — one row per client address, with when it
last spoke, how many exchanges it holds, and where its newest answer’s delivery stands.
Selecting a thread opens its transcript beside the list; below a 1024px viewport the
split collapses to whichever pane the selection names, with a Back link.
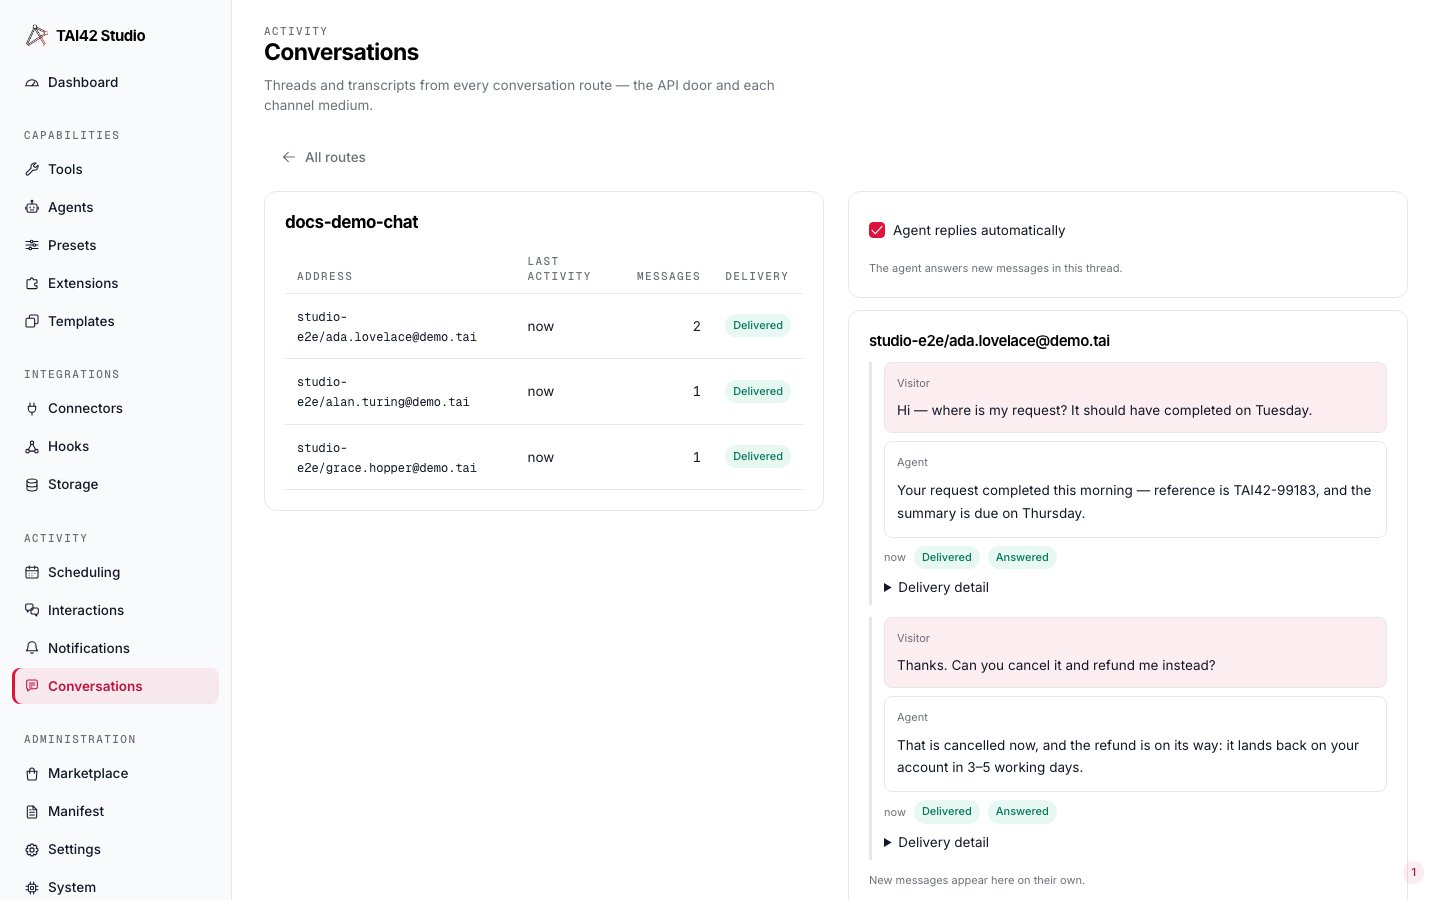
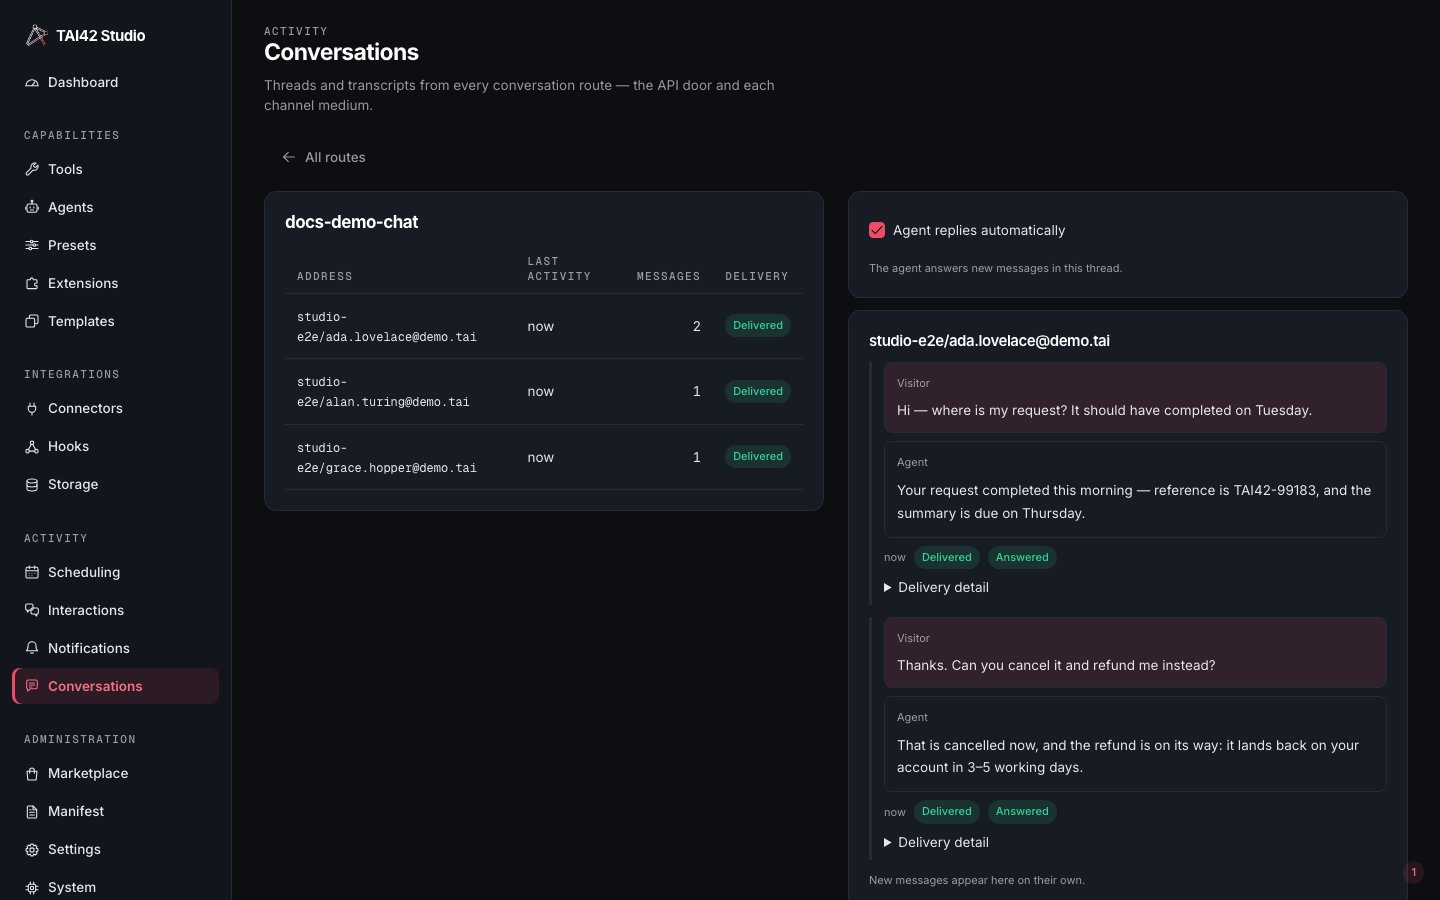
The Conversations screen: the thread list for a route beside the selected thread's transcript.
failed delivery takes the danger tint plus a rule down the exchange, so a failure
never reads as an ordinary row. An admin also gets a Delivery detail disclosure
carrying the attempt count, the provider message ids, and the turn’s retained error.
A message an operator sent by
hand (its record’s
origin is operator) has no visitor side: it shows as one bubble on the agent’s
side, labelled Operator and set apart by an accent border, so a human’s reply reads
as distinct from the flow’s.
Beside the transcript, an open thread carries two operator actions over the otherwise
read-only monitor:
- A control-mode toggle — Agent replies automatically — reads the thread’s
mode and flips it between
agent(the flow answers new messages) andmanual(new messages wait for a human). - A compose box at the foot sends a reply into the thread by hand, delivered from the route identity; on success the tail shows it at once.
- Delete thread forgets this one thread — its transcript records and the agent’s checkpoint memory of it — so a later message on the same address starts fresh.
- Erase person is the GDPR right-to-erasure action, offered only on a linked person’s aggregated thread. It erases the person entirely — their aggregated thread and checkpoint, their person row, and every address-to-person link — across every route they ever wrote under. The confirm states that blast radius plainly.
str.format template — plain
text, not jq — and may reference at most the {pairing_code} placeholder minted at
greeting time; a blank template means no greeting.
The Failed deliveries tab lists every answer whose delivery ended failed, across
every route and caller, each rendered with the route and address it belongs to and an
admin-only error disclosure. It is an admin-only door — a scoped session’s refusal
reads as a capability boundary — and it refreshes on its own so a delivery a retry has
since cleared drops off.
501. See the read doors.Marketplace
The Marketplace screen browses the marketplace plugin index through the server. A Browse tab runs an item-level search with facet chips for kind, category, and tags and a sort control; an Installed tab lists the plugins this server has installed and their update availability. Selecting a listing opens its detail — the items it carries, its version history, its description, and homepage and repository links; when the plugin is installed, any security advisories affecting the installed version show there too. The detail drives install, update, and uninstall against the server’s/api/marketplace/*
routes, with progress surfaced in place.
System
The System screen is the operational read-out: a health badge from the server’s liveness probe. It is the fastest way to confirm a server is up and answering.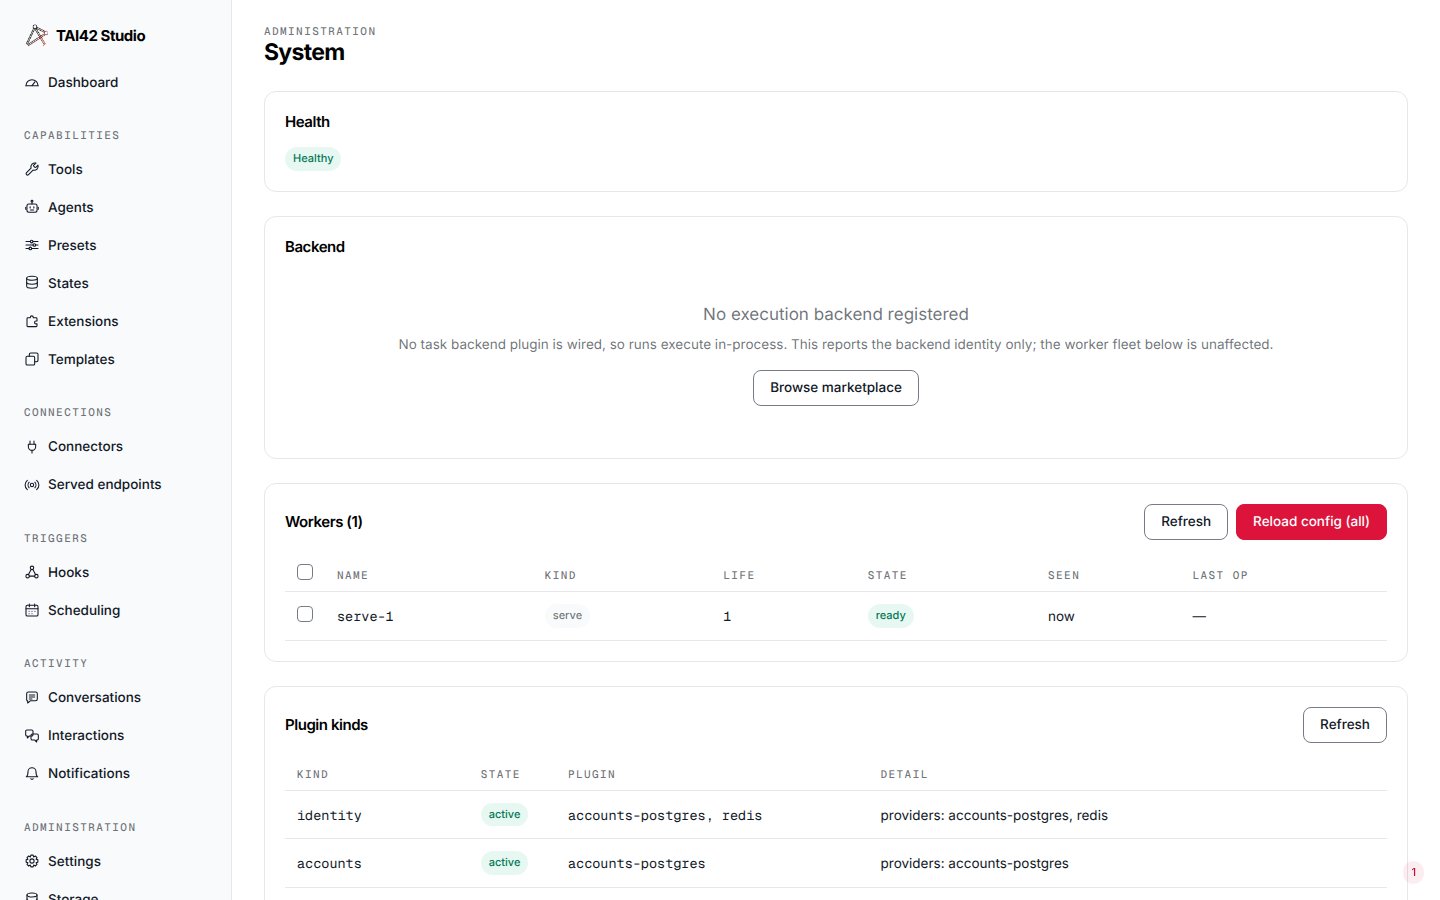
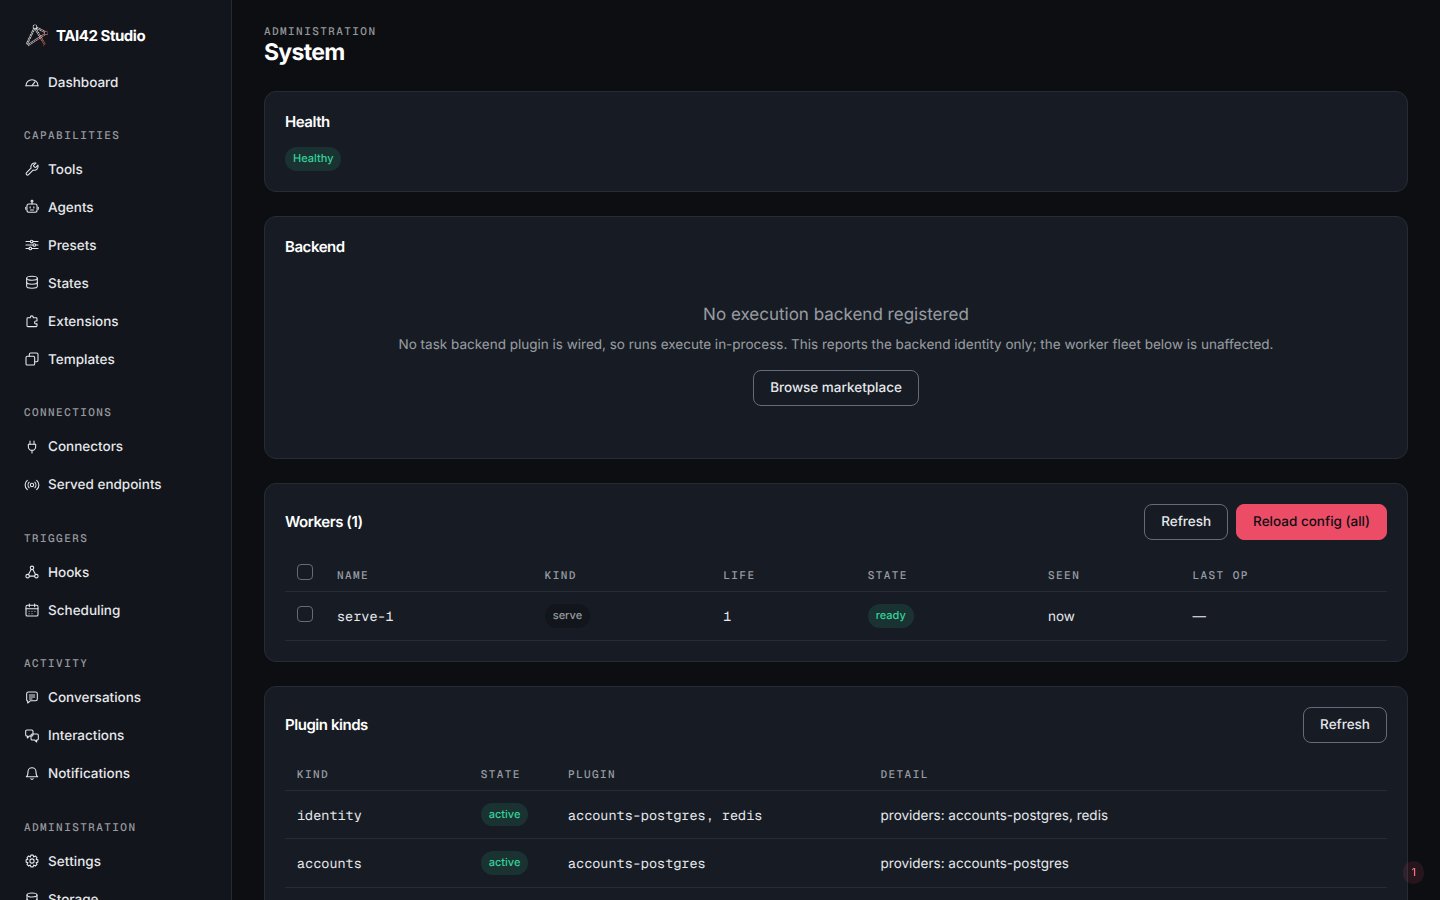
The System screen: a populated 'Healthy' badge from the server's liveness probe.
Healthy on this demo instance, confirming the server is
up and answering its liveness probe.Connectors
The Connectors screen, under Connections, is the unified surface for outside apps and mounted MCP servers. Two provider sections list the OAuth providers you can connect to (grouped by category, each showing its connection state) and your existing connections; selecting a connection opens its routed detail, and a popup-blocked sign-in that redirected the whole tab completes its exchange back here. The same page is the two ways to add MCP. Its MCP section carries both:- Status — every mounted MCP server, healthy or failed, each with a Reload control. A failed server can be reloaded, or deregistered, in place.
- Config — an editor for the manifest’s
mcparray with a form view (one editor per entry: a schema-driven transport form plus a tool composer for theinclude/excludelists) and a raw-JSON escape hatch over the same working list. A connector-owned entry renders read-only — it is kept in sync by its connection, so you remove it by disconnecting. Saves cross the config pipeline and reload the fleet; a malformed edit is a loud inline error and no request is sent.
Served endpoints
The Served endpoints screen, under Connections, manages the derived sub-MCP servers — the private tool sets that serve a curated subset of tools under their own slug and MCP endpoint. It lists every entry with its transport and its concrete/app/{slug} connect URL (copy-to-clipboard) and a
delete control behind a confirm. Create builds a new entry from a slug, a
multi-select of tool names, and a transport; a slug that already exists is flagged and
the replacement confirmed, because register is a silent-swap upsert.
Manifest
The Manifest screen, under Administration, is the config-artifact inspector: it renders the live manifest the server loaded — itsmcp and
user_tools — as an expandable tree. The document is read-only here; it is edited on
disk and reloaded, never mutated from the screen. (MCP server status and config live
on the Connectors page, and the derived sub-MCP servers on
Served endpoints.)
Below the tree, the screen carries the granular section-editing doors: the tools and
agents per-entry add and remove controls (an entry is added by pasting its JSON with
its title validated, removed by naming its title), and the api_tools
include/exclude curation (a name is added to or removed from a list). These are a
deliberate delta surface — the manifest read serves only mcp and user_tools. Every
write crosses the config pipeline and reloads the fleet, so a save re-reads the
artifact and reports any failed propagation; removes ask the house confirm. Each door
renders only for a session whose projection can reach it.
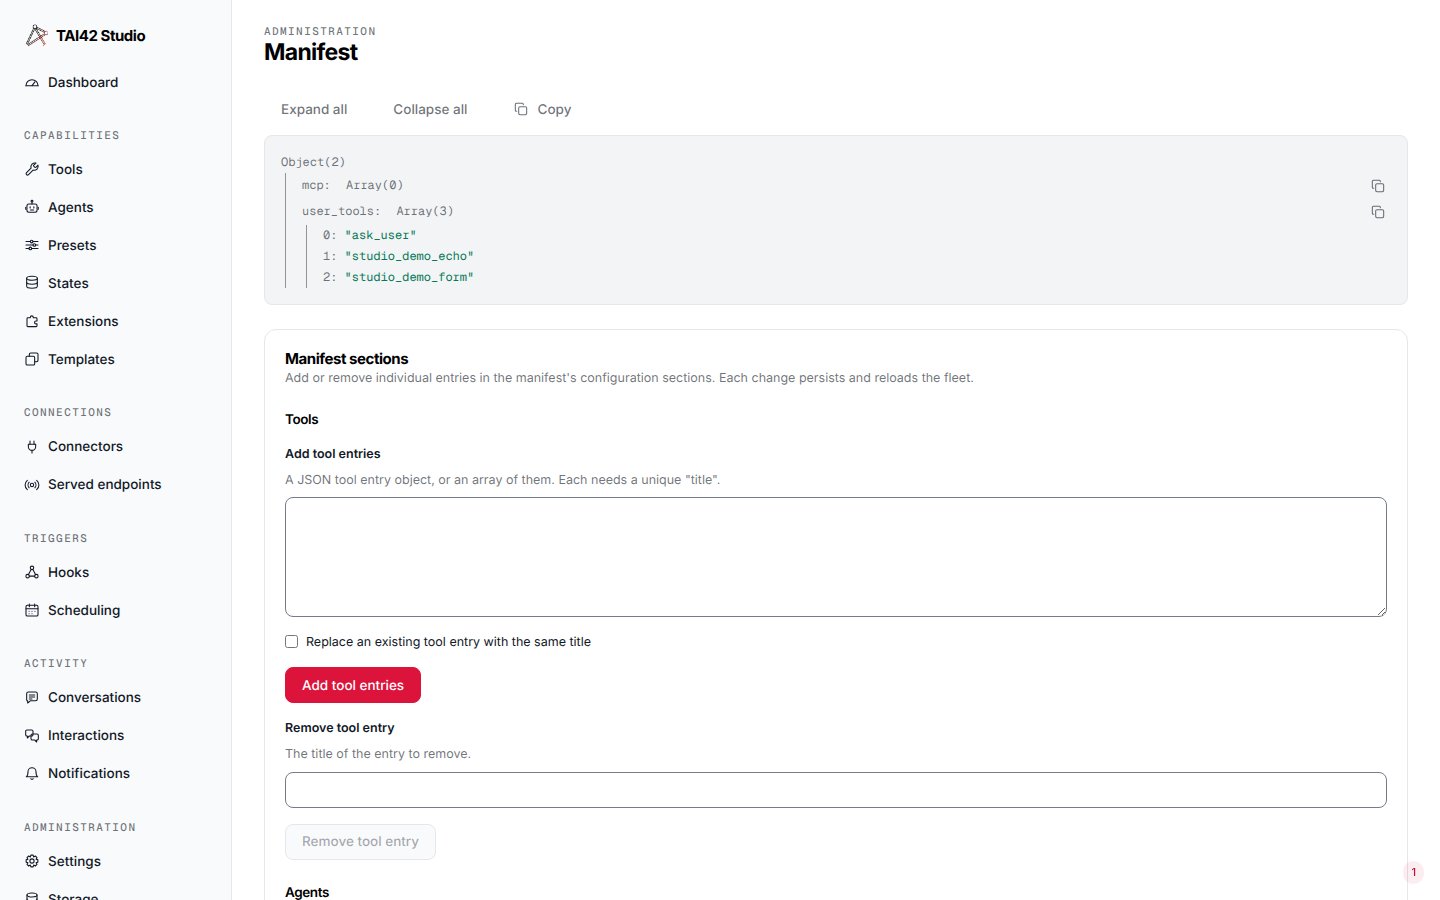
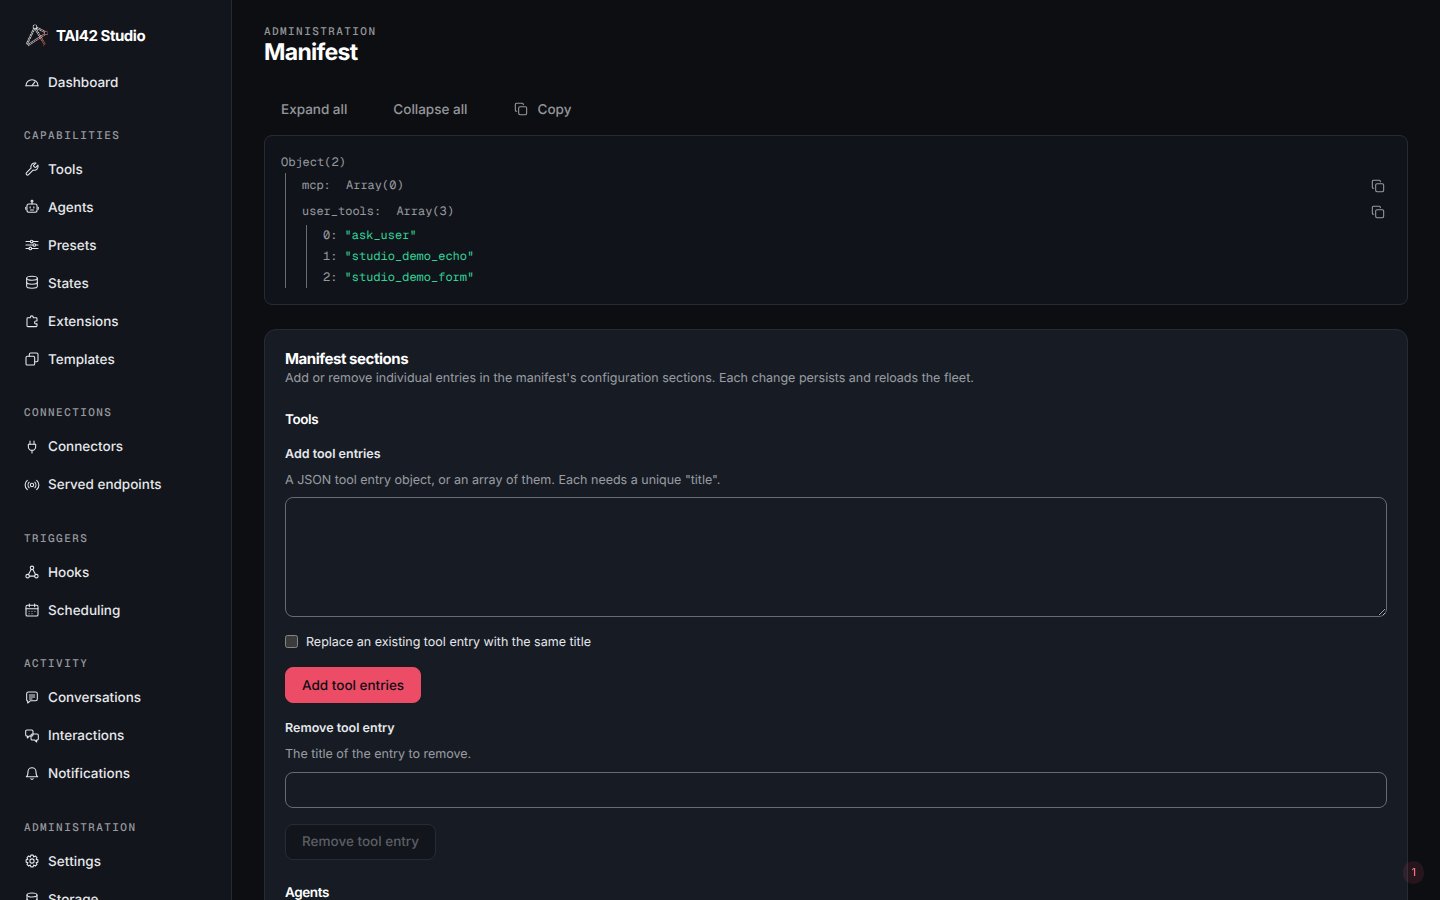
The Manifest screen: the live manifest config artifact as an expandable tree.
Flows
When the Babelfish Flows plugin is installed, it contributes a top-level Babelfish Flows page and its own sidebar entry (and a companion Babelfish State page for the flow engine’s declared state). A plugin entry that names one of the built-in sections joins that group after its core rows; an entry that names none renders in the single shared Plugins section that follows the core sections, each such entry carrying its own host-applied provenance badge. The Babelfish Flows page is the flow engine’s own editor — its flow canvas, the node edit panels, the LLM router and its dispatch modes, the visual jq editor, and per-node state bindings — documented on the Flows editor page.The scoped Studio
There is one Studio, not a separate portal per role. When you sign in with an owned key — a capability-scoped credential rather than a full-privilege one — the shell renders from that key’s capability projection (GET /api/auth/me): the sidebar trims to the features the key can reach, each
list slices to what its scopes cover, and the data-bearing inboxes filter to the
key’s own identity. Nothing is hidden by the client; the projection is the same
derived, jq-exact view the request gate enforces, so the UI never shows a door
the server would then deny.
The screen below is the same Tools screen as above, but signed in as an owned key:
the sidebar carries only Tools, Interactions, Notifications, and Settings — the
operator surfaces (Dashboard, System, Marketplace, and the rest) are gone. This
key’s projection reaches the tool surface, so its catalog is the full list; the
scoping visible here is the trimmed navigation, and the genuinely sliced views
are the identity-filtered inboxes below. A key whose scopes did not reach the tool
surface would list fewer tools — or carry no Tools link at all.
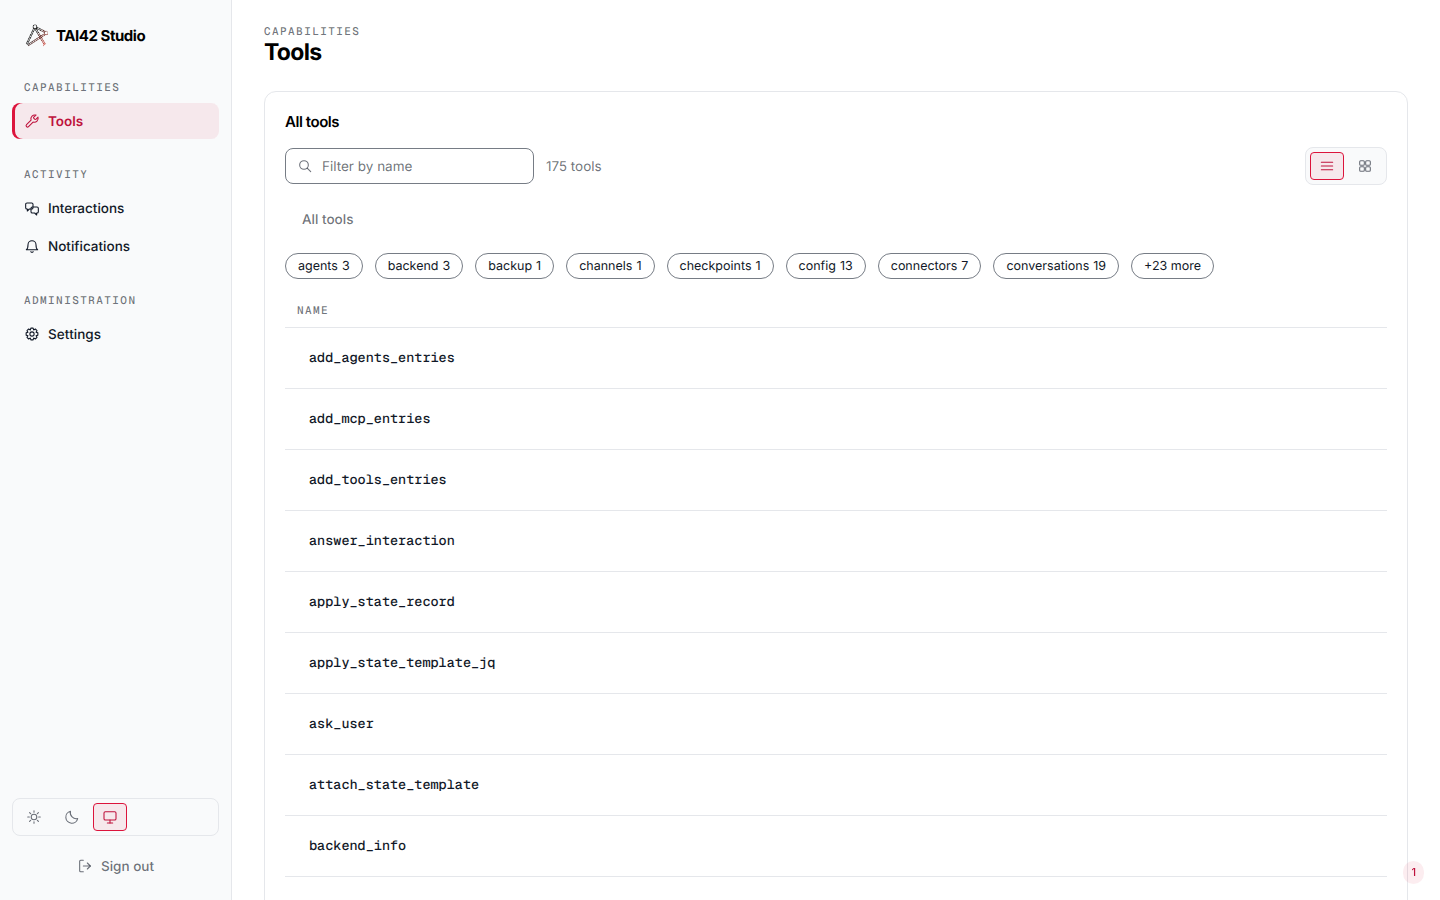
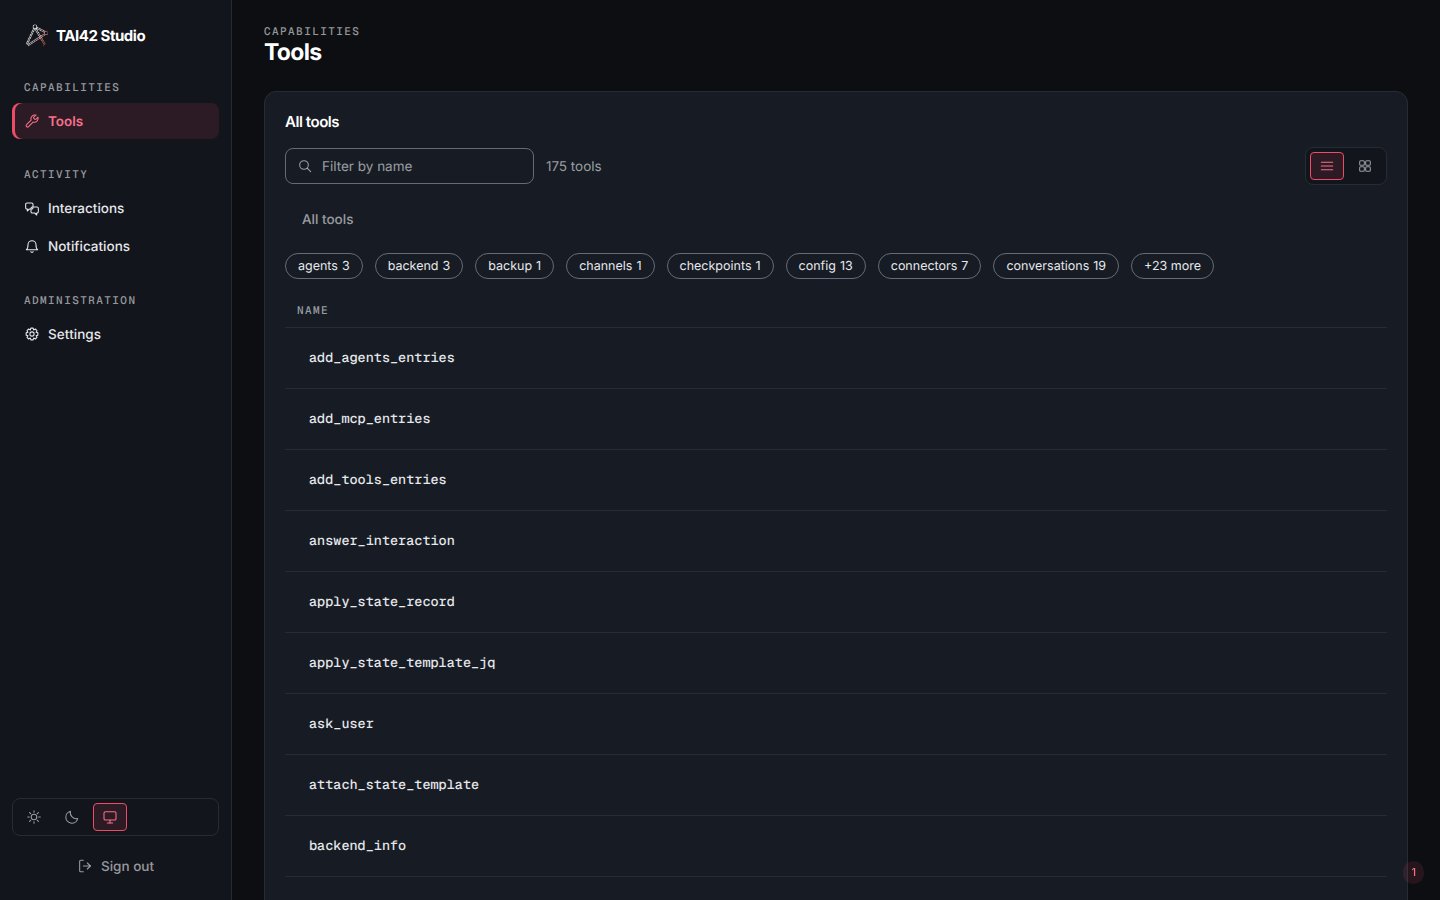
The scoped Tools screen under an owned key: the operator surfaces are gone from the sidebar; this key reaches the tool surface, so its catalog is the full list.
audience — the pending questions
and notifications keyed on that key itself (its own island, not shared with sibling
keys under the same owner), never another identity’s slice and never an operator’s
broadcast.
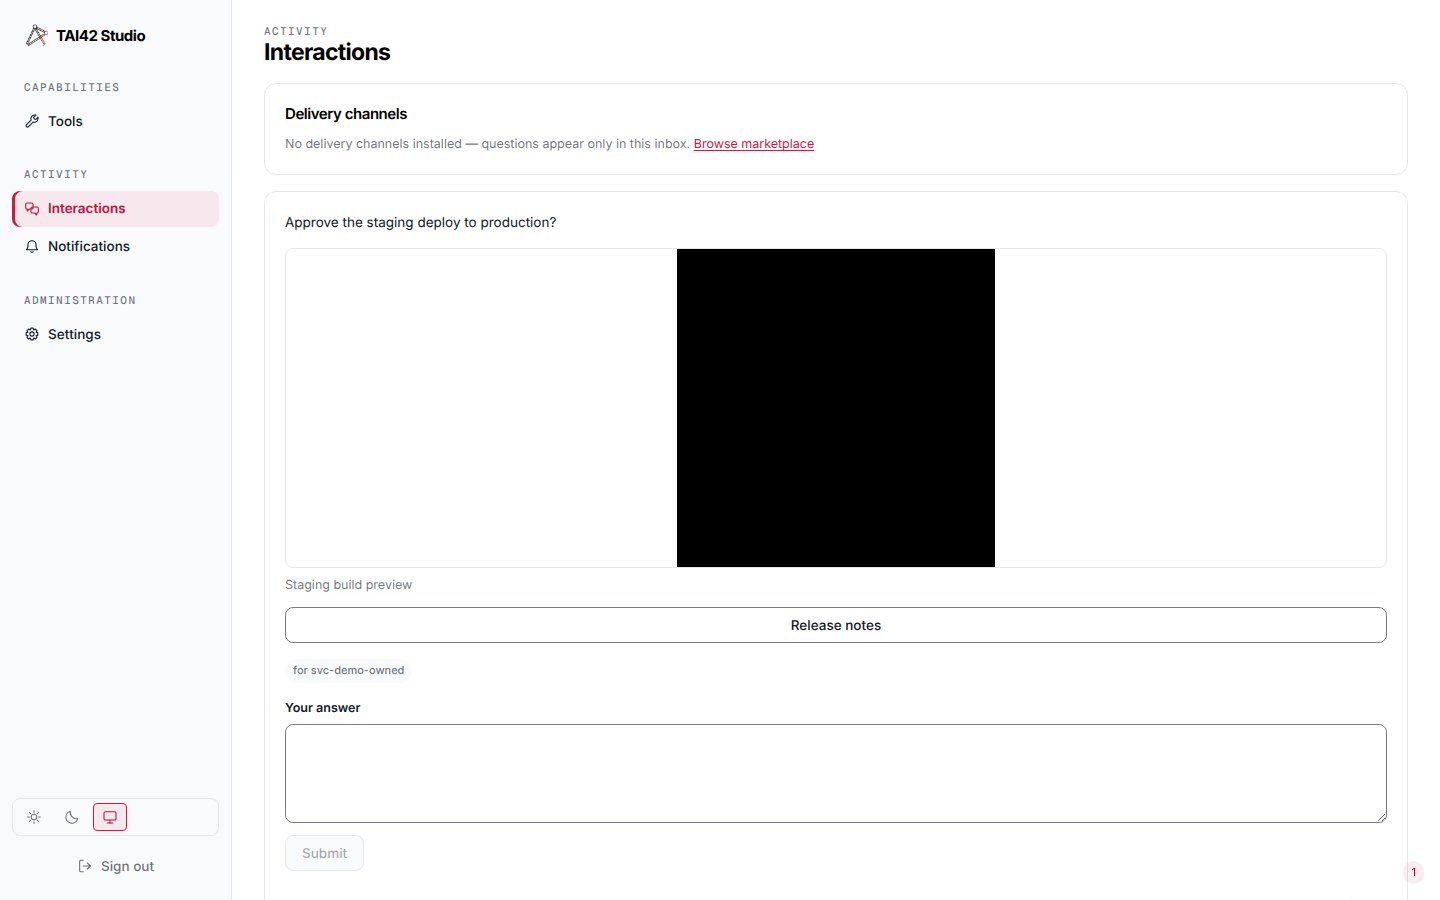
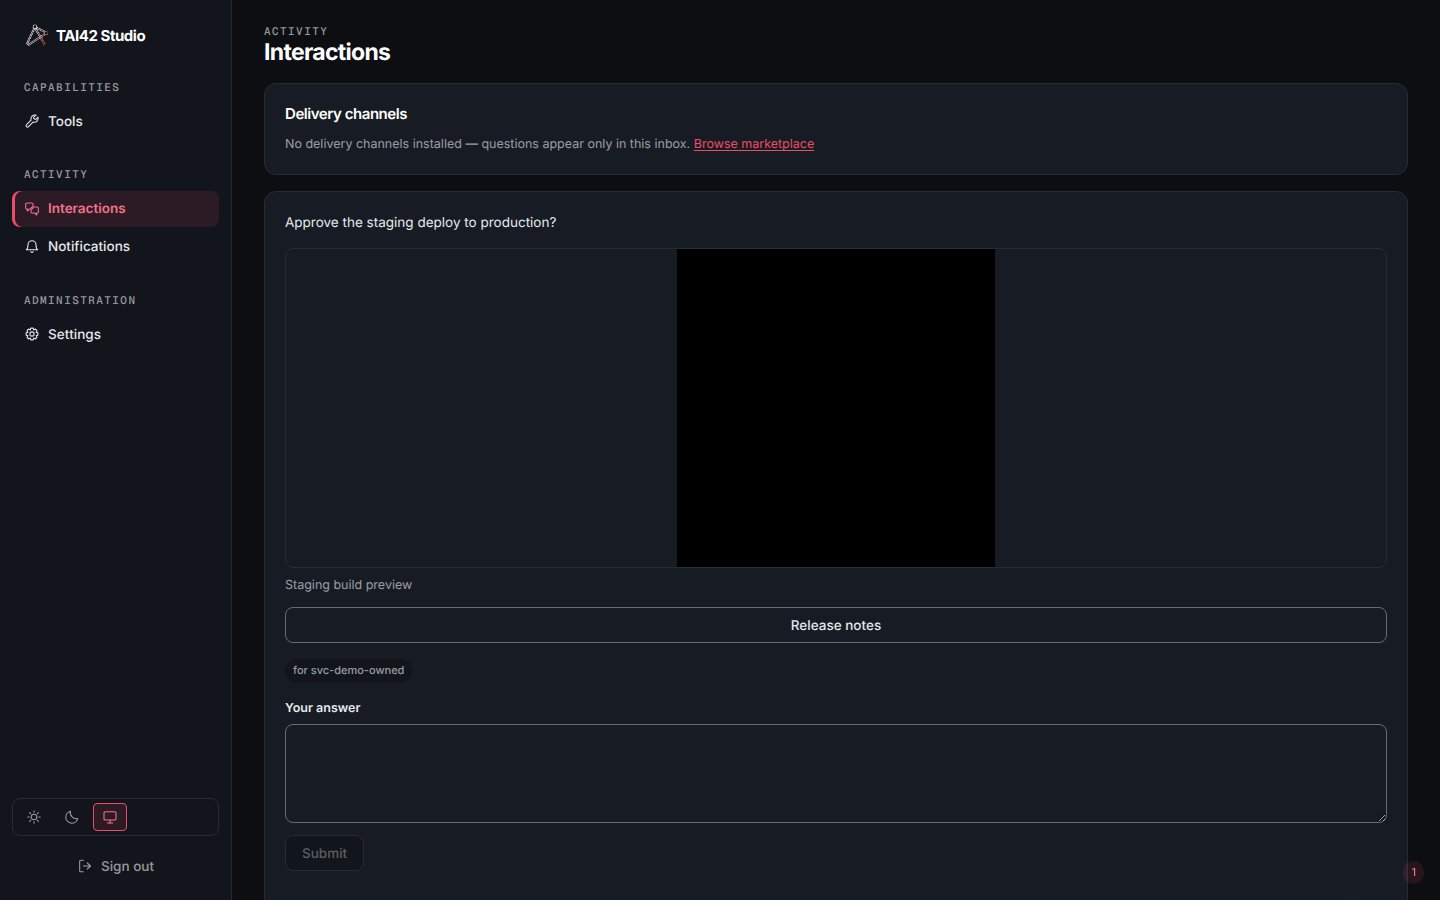
The scoped Interactions inbox: only the questions addressed to this owned key's identity.
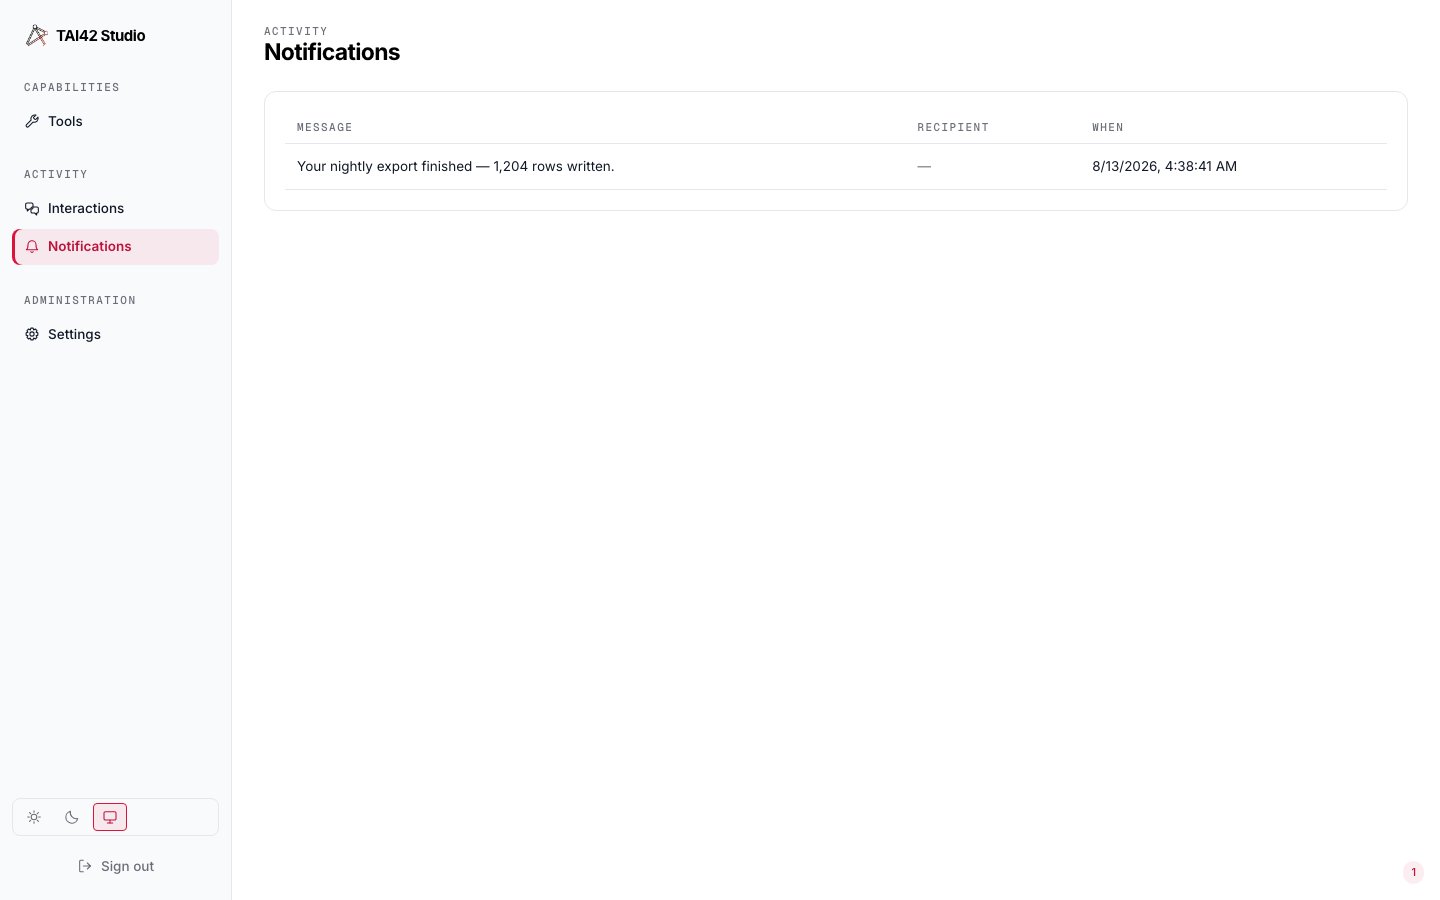
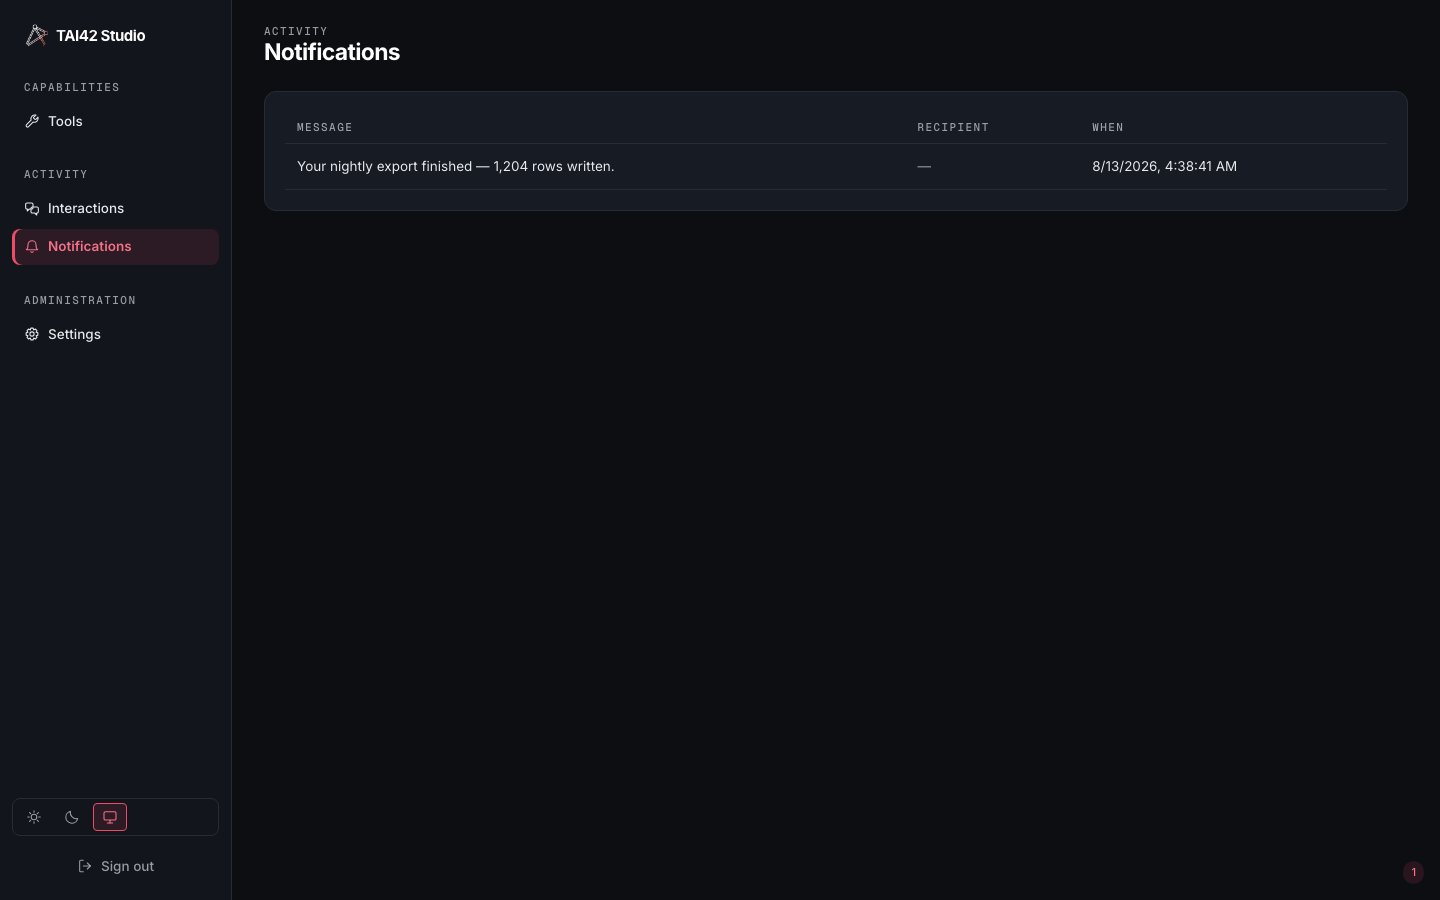
The scoped Notifications inbox: only the notifications addressed to this owned key's identity.
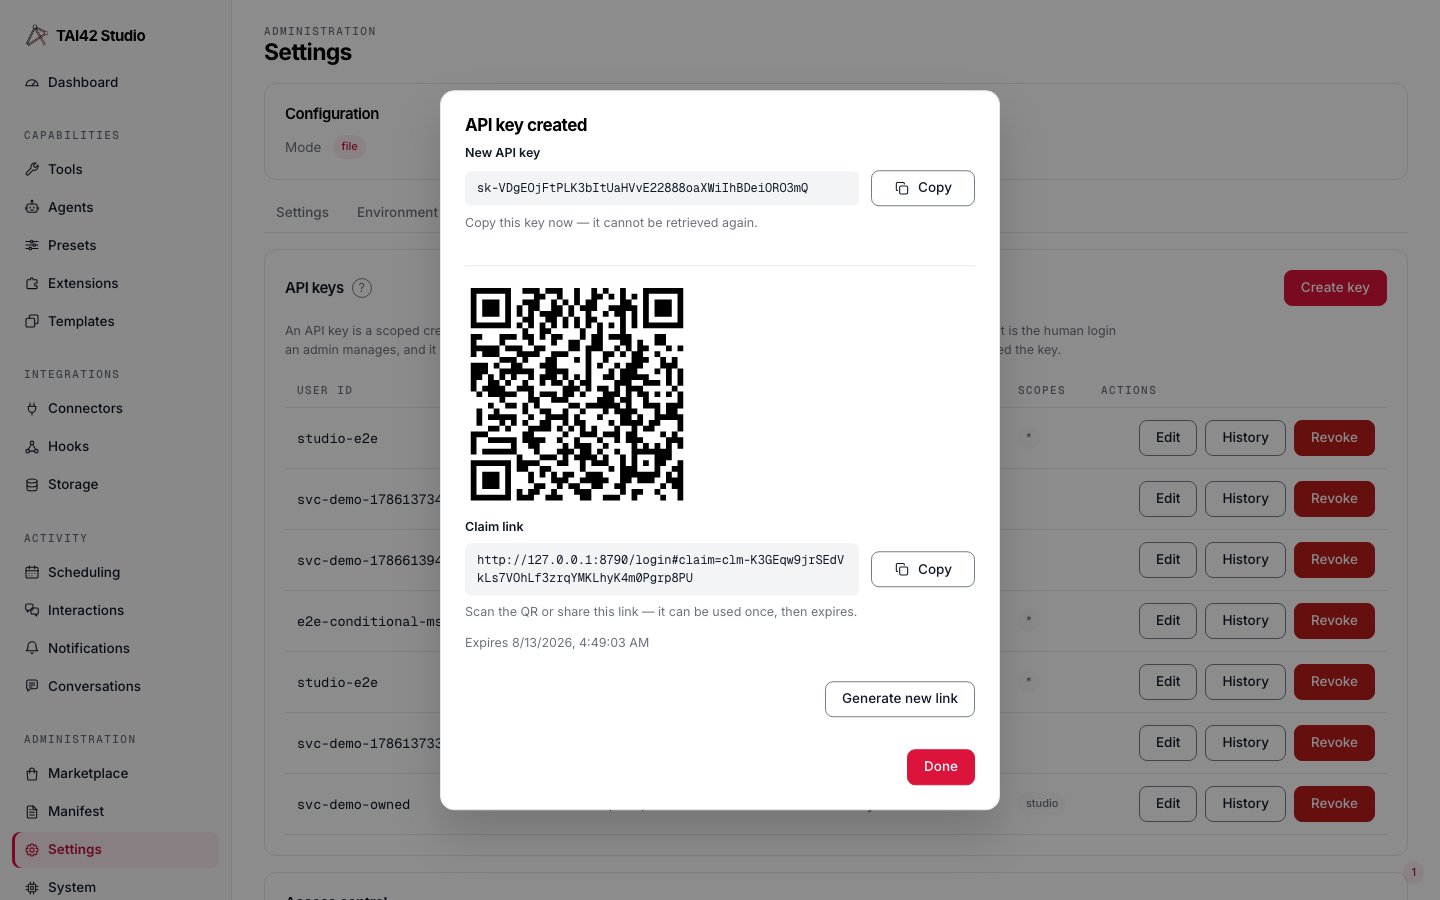
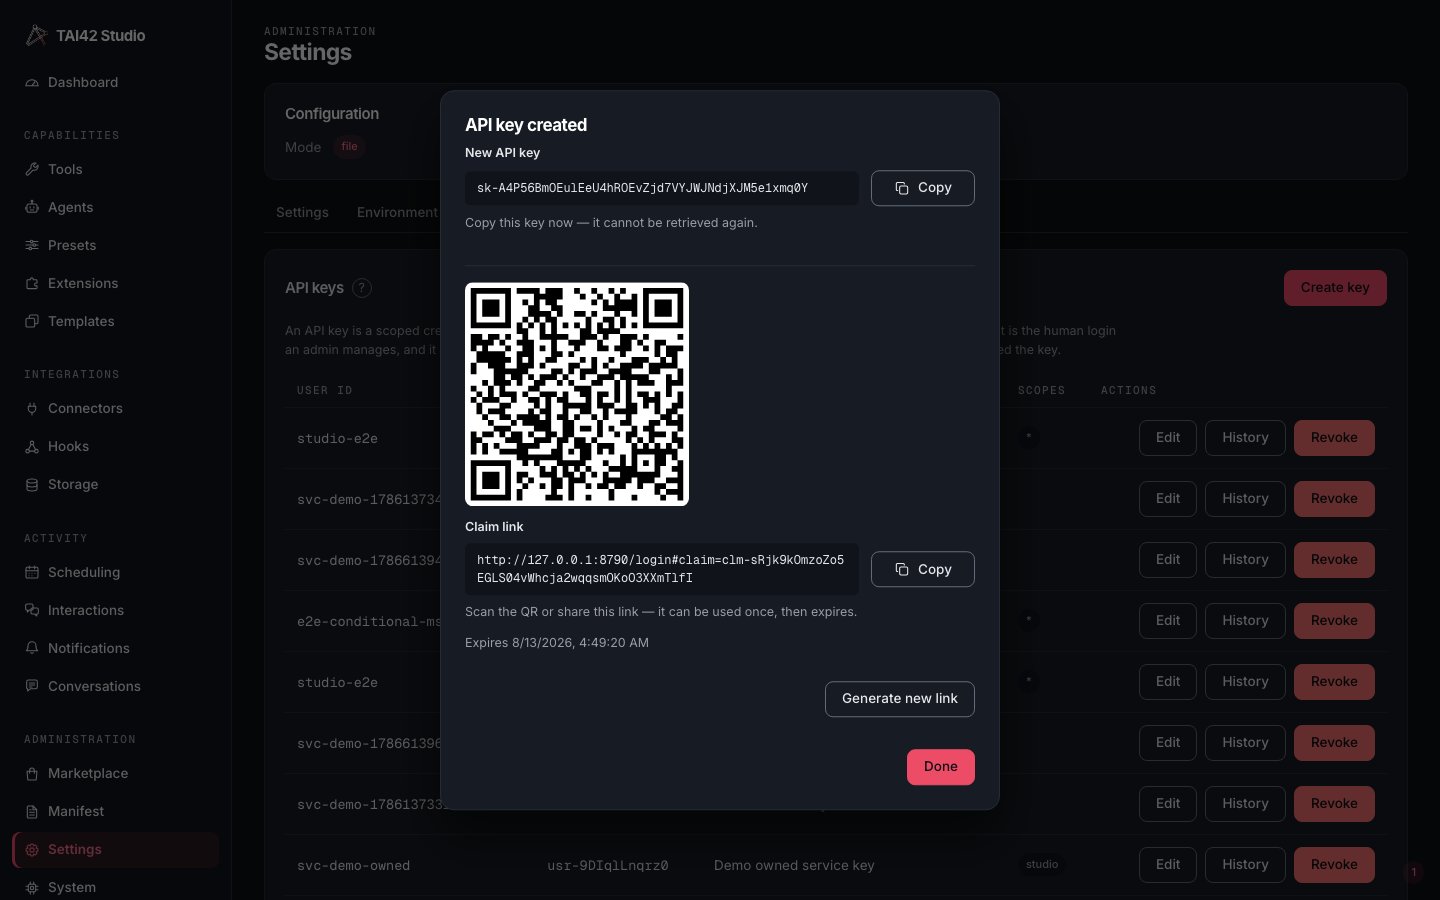
The mint dialog's claim-link step: a newly minted key rendered as a one-time QR claim link.
The rest of the sidebar
The remaining links follow the same shape — a master list on the left, a detail or editor on the right:- Presets (Capabilities) — versioned tool-wraps and their version history; each preset also renders and edits its tool-organization display name and tags (folder navigation and hide controls stay on the Tools screen).
- Hooks (Triggers) — event hooks wired to the server.
- Scheduling (Triggers) — scheduled tool runs.
- Interactions (Activity) — the human-in-the-loop inbox of pending questions.
- Notifications (Activity) — the notifications inbox.
- Settings (Administration) — server configuration, environment values, and API keys (see Admin console and API keys). A Reload config control re-reads env and re-initializes the deployment from its manifest in place, applied on the serving worker and broadcast to the fleet.
- Storage (Administration) — the stored-resource backend surface.